[Security Solution] Alerts Treemap and Multi-Dimensional Alert Grouping #126896
Conversation
|
This draft PR is ready for discussion, but not code review |
3e83243 to
74967a3
Compare
d075678 to
9bf04dd
Compare
Archived: Original POC designFor reference, this comment archives the original ON week POC design from the initial commit, when the PR was opened as a [Security Solution]
|


Archived: Recommended groups POCIn this release, users must manually select Group by fields that pair well together, e.g. parent and child processes, or process name and file name. For reference, this comment archives the Recommended groups POC, where we may proffer curated groups that pair well together, demonstrated in the video below: recommended_groups.movAbove: A video demonstrating the Recommended groups (POC) |
Archived: Color palette selection POCIn this release, the colors of the alerts displayed in the treemap are determined by the rule's risk score. For reference, this comment archives the Color palette selection POC, demonstrated in the video below: color_palettes.movAbove: A video demonstrating the Color palette selection (POC) |
9bf04dd to
5006af7
Compare
| export const RISK_COLOR_HIGH = euiLightVars.euiColorVis7; | ||
| export const RISK_COLOR_CRITICAL = euiLightVars.euiColorVis9; | ||
|
|
||
| export const RISK_SCORE_LOW = 21; |
There was a problem hiding this comment.
Can you add a comment just detailing why the values are these. We may want to reference this for the docs team as well
There was a problem hiding this comment.
Can you add a comment just detailing why the values are these. We may want to reference this for the docs team as well
😂 I didn't define or change these values, so I can't speak to, or document why for example low is 21.
This PR merely takes the previous definition of these values:
export const defaultRiskScoreBySeverity: Record<Severity, number> = {
  low: 21,
  medium: 47,
  high: 73,
  critical: 99,
};
and exposes them as constants for use in other files.
| page: ALERTS_PAGE, | ||
| setting: STACK_BY_1_SETTING_NAME, | ||
| }), | ||
| plugin: APP_ID, |
There was a problem hiding this comment.
Yea, I'd say let's default plugin APP_ID in the actual useLocalStorage. It can be in a follow up PR for sure if it'll be too much of a headache here with the tests 😂
There was a problem hiding this comment.
Yea, I'd say let's default plugin
APP_IDin the actualuseLocalStorage. It can be in a follow up PR for sure if it'll be too much of a headache here with the tests 😂
done! 😄
There was a problem hiding this comment.
Checked out, tested locally, and pair reviewed with @andrew-goldstein. Thank you for taking the time to go over everything here @andrew-goldstein, and for all your efforts in getting this amazing new alert triaging component in place! 🎉 This is going to greatly impact analysts alert triage experience, and is a step forward in optimizing and enhancing their workflow! ![]()
Overall everything in testing and review LGTM, so approving as-is. In testing we did come across a few items, so I'll note them below, but no need to address these as part of this PR, so feel free to either pickup in a follow-up, or create an issue for tracking/discussion as you see fit.
Welcome TreeMap! 🙌 LGTM! 🌲 🗺️ 🚀
Notes
Tree map isn't displayed for certain `group by top` fields, like `Ransomeware.version`, or `tags`
- Consider a 'empty state' message similar to
No data to displaywhen both group by fields aren't supplied.

Extra left margins on `Table` view

Consider not refreshing/clearing data when deleting `group by` until focus is lost (or another selection is complete)
- With regards to the
group byselection UX, consider not updating data until a new field is selected, or focus is lost when empty (to prevent an unnecessary refresh when selecting a new field):

Allow `enter` to select initial item in group by components
- When typing a field name we require an extra down-arrow + enter instead of just enter to confirm the first match (even if exact):

Consider mirroring same table/trend/tree component on Rule Details
- I've always kinda paired the visualization above the Alerts table with the table itself, so it was interesting to see that we kept just the
trendvisualization on the Rule Details page. I think it would be an added benefit to mirror this new visualization UI on the Rule Details as well, so users have access to the treemap for additional grouping at the Rule layer. Would likely want it to have their own localstorage values and default group by's.

|
Side note: really loved the |
2988064 to
8f98055
Compare
| @@ -65,7 +68,6 @@ export const closeAlerts = () => { | |||
|
|
|||
| export const expandFirstAlertActions = () => { | |||
| cy.get(TIMELINE_CONTEXT_MENU_BTN).should('be.visible'); | |||
| cy.get(TIMELINE_CONTEXT_MENU_BTN).find('svg').should('have.attr', 'data-is-loaded'); | |||
There was a problem hiding this comment.
The should allow a user with crud privileges to attach alerts to cases test in attach_alert_to_case.spec.ts invokes the expandFirstAlertActions() test helper.
The test is failing on CI with the following error:
AssertionError: Timed out retrying after 120000ms: expected '<svg.euiIcon.euiButtonIcon__icon.css-e8xmlg-euiIcon-m-inherit>' to have attribute 'data-is-loaded'
    at expandFirstAlertActions (http://localhost:5620/__cypress/tests?p=cypress/integration/cases/attach_alert_to_case.spec.ts:22991:60)
    at Context.eval (http://localhost:5620/__cypress/tests?p=cypress/integration/cases/attach_alert_to_case.spec.ts:21750:50)
The expandFirstAlertActions() test helper in cypress/tasks/alerts.ts was updated ~ 21 hours ago with this change: https://github.com/elastic/kibana/pull/135373/files#diff-9881e669a4305a15a96f3880d5d68906edfc15991e384a71d7ef5498ed04c0c8R68hh
Based on desk testing, the data-is-loaded attribute:
- Only indicates whether or not the button's SVG is loaded (it's an implementaiton detail of EUI: https://github.com/elastic/eui/blob/b151438410eb39a39c4540e04810a5023530d77f/src/components/icon/icon.tsx)
- Does not seem to be reliable: When inspecting the DOM via dev tools, the attribute is not present, but the icon is clearly visible / loaded
Based on the git history, it looks like the expandFirstAlertActions() test helper didn't include this check:
cy.get(TIMELINE_CONTEXT_MENU_BTN).find('svg').should('have.attr', 'data-is-loaded');in it's original implementation. The check was first added in this PR: 683463e#diff-9881e669a4305a15a96f3880d5d68906edfc15991e384a71d7ef5498ed04c0c8R68
Since this check only determines whether or not the SVG was loaded in the button icon, and data-is-loaded does not appear to be reilable, I'm removing this cy.get.
There was a problem hiding this comment.
Sounds good 👍
I was the one that actually added that check, so for context, this is the comment that details the change: #130072 (comment)
When I ran into this I had no issue with it passing locally, but it would fail on CI, so you may have to click-loop and/or wait for the menu if there's still an issue waiting on the table to load before the icon is visible to click.
| @@ -99,9 +99,9 @@ export const goToExceptionsTab = () => { | |||
| }; | |||
|
|
|||
| export const editException = () => { | |||
| cy.get(EXCEPTION_ITEM_ACTIONS_BUTTON).click(); | |||
There was a problem hiding this comment.
The Displays version conflict error and Displays missing exception list error tests in exceptions_flyout.spec.ts invoke the editException() test helper.
This editException() helper function was added ~ 4 days ago, via this PR and is failing on CI with the following error:
CypressError: Timed out retrying after 120050ms: `cy.click()` failed because the center of this element is hidden from view:

`<button class="euiButtonIcon euiButtonIcon--primary euiButtonIcon--empty euiButtonIcon--xSmall" type="button" aria-label="Exception item actions menu" data-test-subj="exceptionItemCardHeader-actionButton">...</button>`

Fix this problem, or use `{force: true}` to disable error checking.
The test passes locally. I'm implementing the fix suggested in the error message above.
…ity-team#3221) to the Alerts page:  _Above: The new `Alerts by risk score` treemap_ - Alerts are colored by risk score - Clicking on a cell instantly filters the alerts page - Users may specify custom fields to group by, or quick-select from our curated sets of fields that pair well together The features in this PR are enabled via the following feature flag in [experimental_features.ts](https://github.com/elastic/kibana/blob/main/x-pack/plugins/security_solution/common/experimental_features.ts): ```ts alertsTreemapEnabled: true, ``` When the feature flag is **disabled**, the alerts page looks like `main` today:  _Above: This branch, when the feature flag is disabled_ When the feature flag is enabled, the layout of the Alerts page incorporates the design detailed in <elastic#120287>, which eliminates unusable space at the top of the Alerts page, and enables users to quickly hide and show the charts. Users are introduced to the new `Hide charts` feature of the layout via `Step 1` of an [EUI Tour](https://elastic.github.io/eui/#/display/tour):  _Above: `Step 1` of the tour introduces the `Hide charts` feature_ Users may (optionally) try the `Hide charts` feature as part of the tour, per the video below: <https://user-images.githubusercontent.com/4459398/156709026-ac16c97b-167e-4fce-b0e0-fd16077027b1.mov> _Above: (video) The interactive tour let's users experience the new `Hide charts` feature_ `Step 2`, the final step of the tour, introduces the view selector:  _Above: `Step 2` of the tour introduces the view selector_ Per the screenshot and video below, view selection toggles between the default `Trend view` and the new `Alerts by risk score view`:  _Above: View selection_ <https://user-images.githubusercontent.com/4459398/156710378-3b9461c1-9779-4d66-8f12-21709d6f25fc.mov> _Above: (video) View selection toggles between the `Trend view` and the `Alerts by risk score view`_ We store the user's chart visibility and view preferences in local storage. When users navigate to other views in Kibana or close the browser, their chart visibility and view preferences are restored the next time they visit the Alerts page. Every rule, including prebuilt Elastic rules and custom rules created by users, must specify a risk score at rule creation time, per the screenshot below:  _Above: Every rule has a risk score specified when it's created_ The colors of the alerts displayed in the treemap are determined by the rule's risk score. This makes it easy to quickly filter the entire alerts page by clicking on the riskiest alerts, per the video below: <https://user-images.githubusercontent.com/4459398/156714075-75112515-a247-4aa4-bc58-52fd17ce6fa0.mov> _Above: (video) Users click on the riskiest alerts to filter the page_ Clicking on a cell in the treemap adds two filters, one for each group by field:  _Above: Two filters, (one for each group by field), are added to the page when a cell is clicked_ In the screenshot below, the 2nd filter was removed to reveal all the hosts in `mimikatz process started` alerts:  _Above: Removing the 2nd filter, `host.name`, revealed all the hosts in the `mimikatz process started` alerts_ We can instantly answer questions like "Did this host trigger alerts for other rules?", and at a glance, grok the severity of those alerts, by removing the first of the two filters:  _Above: Removing the first filter, `kibana.alert.rule.name`, revealed other alerts (from different rules) triggered for a specific host_ Users may customize the group by criteria: <https://user-images.githubusercontent.com/4459398/156720911-8ed26b24-658f-4cc3-85b2-f317e15c430c.mov> _Above: (video) Entering custom group by criteria_ When users navigate to other views in Kibana or close the browser, the previously-selected group by fields are restored from local storage the next time they visit the Alerts page. Clicking on the first menu item in the settings gear, `Reset group by fields`, restores the default group by fields, per the video below: <https://user-images.githubusercontent.com/4459398/156722389-2927d4e4-f8e8-4113-88d7-274a7c1e4bbe.mov> _Above: (video) Restoring the default group by fields_ Users may quick-select from Elastic-curated sets of fields that pair well together, like parent and child processes, or process and file name:  _Above: Quick-select from Elastic-curated sets of fiels_ Previous versions of the `Count` table were limited to grouping by one field. This PR enhances it to support grouping by two fields, per the screenshot below:  _Above: The `Count` table now supports two group by fields_ The group by criteria of the `Count` and `Alerts by risk score` widgets are linked together, making it easy to toggle between the two views, per the video below: <https://user-images.githubusercontent.com/4459398/156727296-59fc1f29-e7a2-45eb-a549-5317100ab68a.mov> _Above: (video) The `Count` and `Alerts by risk score` group by criteria are linked_ The `Trend` chart's legend has been enhanced to display counts, per the design detailed in issue <elastic#120282>  _Above: The `Trend` chart legend, enhanced to display counts_ Note: The original intention of adding counts to the `Trend` chart legend, as documented in <elastic#120282>, was to combine the `Trend` and `Count` widgets into a single view via the legend. In this PR, the `Trend` and `Count` widget queries have diverged; (the latter now supports multiple group by fields). This prevents the `Trend` and `Count` widgets from being combined into a single view. This PR adds persistence of the `Trend` chart Stack by field to local storage. When users navigate to other views in Kibana or close the browser, the previously-selected field is restored the next time they visit the Alerts page.
…uping This PR introduces the new _Treemap_ and _Multi-Dimensional Alert Grouping_ to the Alerts page. The initial commit was developed as an _ON week_ proof of concept (POC). It has since been updated to incorporate product and UX feedback. ### Alerts treemap The new _Alerts_ page treemap is shown in the screenshot below:  _Above: The new `treemap` in the Alerts page_ - Alerts are colored by risk score - Clicking on a cell instantly filters the alerts page - Treemap legend items may be added to filters and Timeline investigations - The new treemap supports multi-dimensional grouping and filtering - Alerts are grouped by `kibana.alert.rule.name` and `host.name` by default ### Multi-Dimensional Alert Grouping The table on the Alerts page, which previously supported grouping by a single field, has also been enhanced to support multi-dimensional grouping, per the screenshot below:  _Above: The table in the Alerts page, enhanced to support multi-dimensional grouping_ ## Filtering the Alerts page by risk score Every rule, including prebuilt Elastic rules and custom rules created by users, must specify a risk score at rule creation time, per the screenshot below:  _Above: Every rule has a risk score specified when it's created_ The colors of the alerts displayed in the treemap are determined by the rule's risk score. This makes it easy to quickly filter the entire alerts page by clicking on the riskiest alerts. Clicking on a cell in the treemap adds two filters, one for each group by field, per the screenshot below:  _Above: Two filters, (one for each group by field), are added to the page when a cell is clicked_ The Alerts page updates instantly when filters are added or removed. In the screenshot below, the 2nd filter was removed to filter the page to all `mimikatz process started` alerts:  _Above: Removing the 2nd filter, a specific `host.name`, revealed all the hosts in the `mimikatz process started` alerts_ ### Switching views Users may switch between the following views: - Table - Trend (default) - Treemap per the screenshot below: 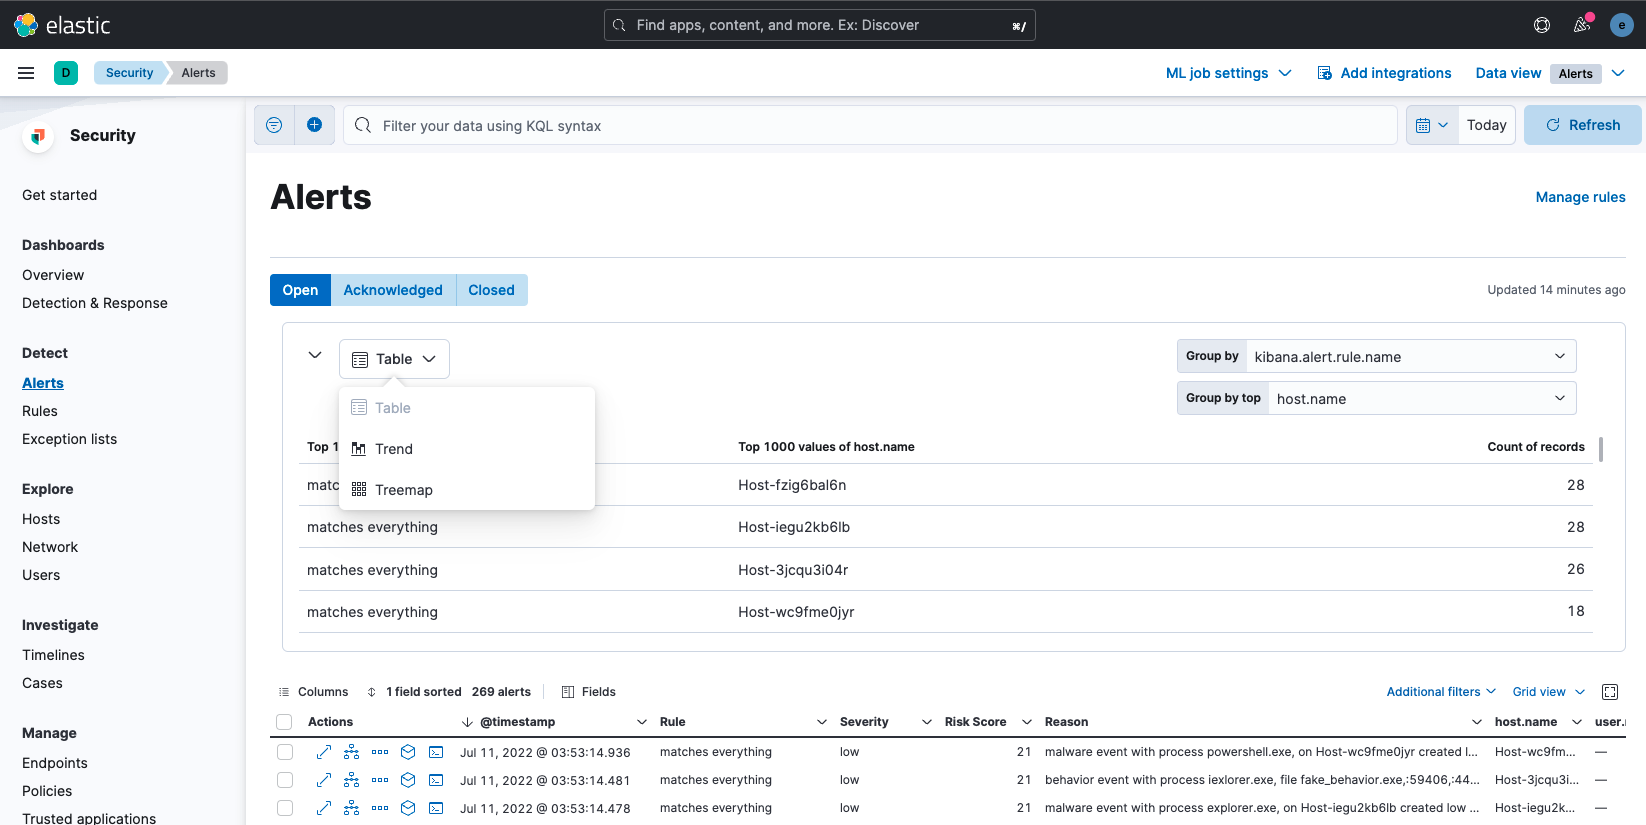 _Above: View selection_ The default _Trend_ view is shown in the screenshot below:  _Above: The (default) Trend view_ - The Trend chart's legend has been enhanced to display counts, per the design detailed in issue <elastic#120282> - The Trend view only supports visualizing a single dimension. Hovering over the disabled `Group by top` select in the Trend view displays the tooltip shown in the screenshot below:  _Above: The Trend view only supports visualizing a single dimension_ ### Collapsing the panel The panel may optionally be collapsed to save space, per the screenshot below:  _Above: The panel (optionally) collapsed_ ### User preferences are persisted to local storage Previously, the _Group by_ selections on the Alerts page were always forgotten when users navigated away from the Alerts page. As a result, users had to re-select their preferred Group by fields every time they visited the page. We now store all of the following preferences in local storage: - View selection (Table, Trend, Treemap) - Group by selections - Panel collapse state The preferences above are now restored the next time users return to the Alerts page. ### Group by field selection is synchronized between views Group by field selection is synchronized between views. For example, if a user changes the Group by fields in the Treemap view and then switches to the Table view, the same Group by fields will be displayed in the Table view. ### Resetting Group by fields to their defaults Users may reset the Group by fields to their defaults (`kibana.alert.rule.name` and `host.name`) for any visualization via the menu shown in the screenshot below:  _Above: Resetting Group by fields to defaults via the menu_
…this PR

### `attach_alert_to_case.spec.ts`

The `should allow a user with crud privileges to attach alerts to cases` test in `attach_alert_to_case.spec.ts` invokes the `expandFirstAlertActions()` test helper.

The `expandFirstAlertActions()` test helper in `cypress/tasks/alerts.ts` was updated ~ 21 hours ago with this change: <https://github.com/elastic/kibana/pull/135373/files#diff-9881e669a4305a15a96f3880d5d68906edfc15991e384a71d7ef5498ed04c0c8R68hh>

Based on desk testing, the `data-is-loaded` attribute:
- Only indicates whether or not the button's SVG is loaded (it's an implementaiton detail of EUI: <https://github.com/elastic/eui/blob/b151438410eb39a39c4540e04810a5023530d77f/src/components/icon/icon.tsx>)
- Does not seem to be reliable: When inspecting the DOM via dev tools, the attribute is not present, but the icon is clearly visible / loaded

Based on the git history, it looks like the `expandFirstAlertActions()` test helper didn't include this check:

```ts
cy.get(TIMELINE_CONTEXT_MENU_BTN).find('svg').should('have.attr', 'data-is-loaded');
```

in it's original implementation. The check was first added in this PR: <elastic@683463e#diff-9881e669a4305a15a96f3880d5d68906edfc15991e384a71d7ef5498ed04c0c8R68>

Since this check only determines whether or not the SVG was loaded in the button icon, and `data-is-loaded` does not appear to be reilable, I'm removing this `cy.get`.

### `exceptions_flyout.spec.ts`

The `Displays version conflict error` and `Displays missing exception list error` tests in `exceptions_flyout.spec.ts` invoke the `editException()` test helper.

This `editException()` helper function was added ~ 4 days ago, [this PR](https://github.com/elastic/kibana/pull/135255/files#diff-e184b6d6539304e06fe6c7cdaa63773a60678e792d2c1b27a9873977c5a4e64bR101) and is failing on CI with the following error:

```
CypressError: Timed out retrying after 120050ms: `cy.click()` failed because the center of this element is hidden from view:

`<button class="euiButtonIcon euiButtonIcon--primary euiButtonIcon--empty euiButtonIcon--xSmall" type="button" aria-label="Exception item actions menu" data-test-subj="exceptionItemCardHeader-actionButton">...</button>`

Fix this problem, or use `{force: true}` to disable error checking.
```

The test passes locally. I'm implementing the fix suggested in the error message above.
8f98055 to
848f8da
Compare
💛 Build succeeded, but was flakyFailed CI StepsTest Failures
Metrics [docs]Module Count
Async chunks
History
To update your PR or re-run it, just comment with: |
This PR contains fixes for the following issues: - elastic#136377 was fixed by using the `key_as_string` value in the search strategy response to format timestamps for the Treemap and Table views, per the screenshots below: **Treemap with timestamp formatting:**  **Table with timestamp formatting:** 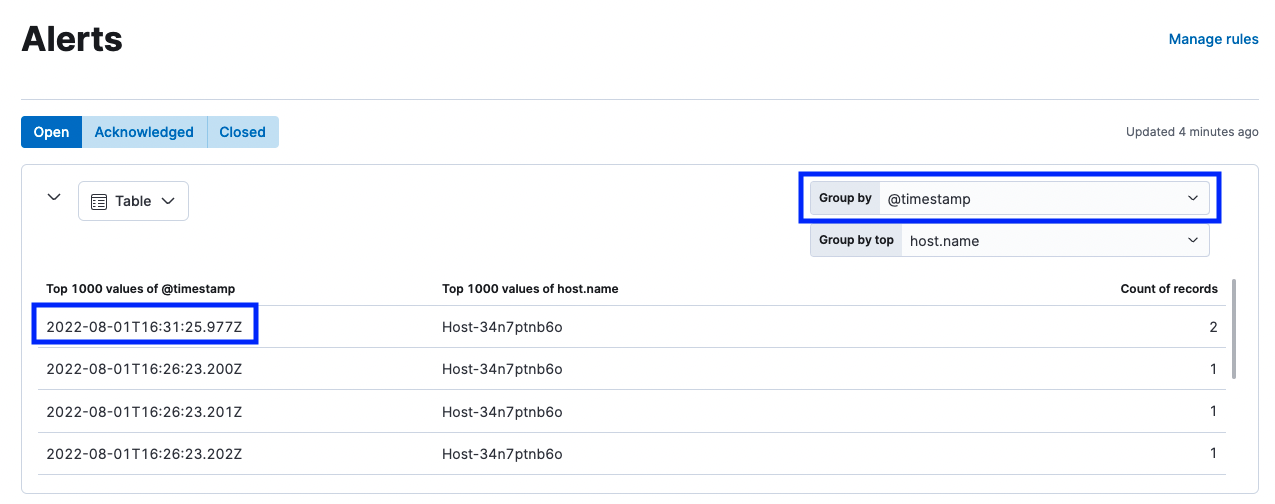 - elastic#136387 was fixed by reducing the mininum font size to `4px` for group names, per [this example](https://elastic.github.io/elastic-charts/?path=/story/treemap--two-layers-stress-test&globals=theme:light;background:white) from Elastic charts. This change: - Reduces the chances of a label getting hidden when the browser is resized, but cannot eliminate it, because at a certain point, Elastic Charts must hide the label in order to (still) render the group - Will result in some groups having very small labels where the group previously would not have them, per the screenshot below: 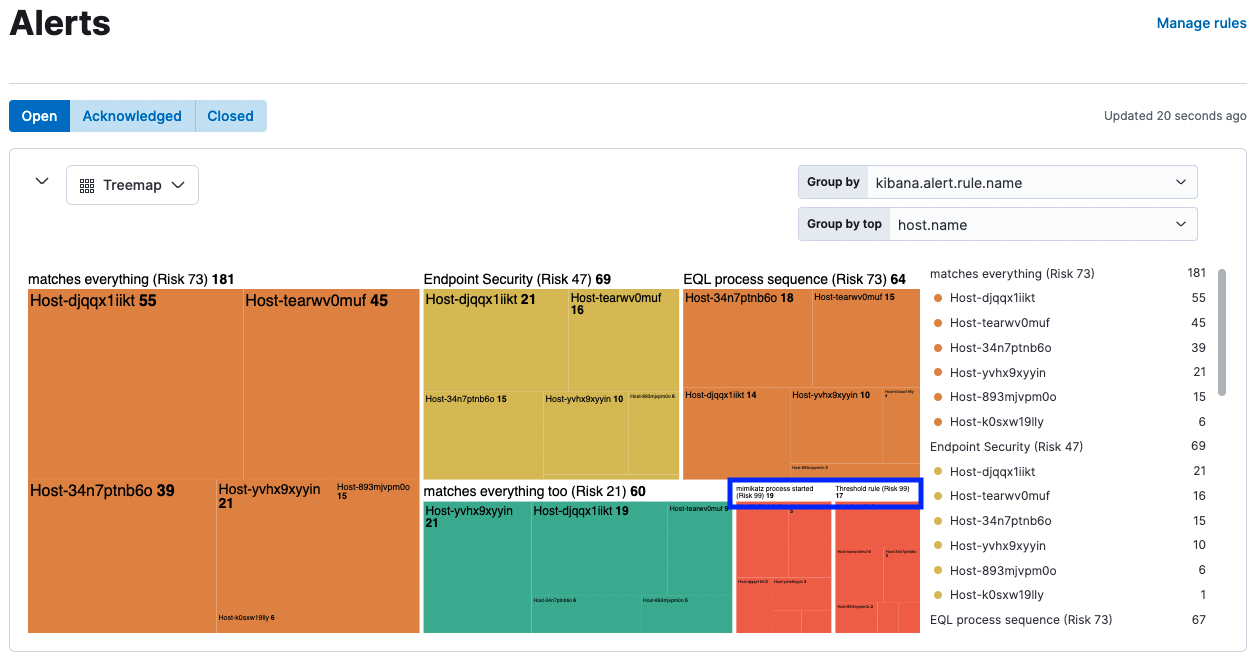 - elastic#136372 was fixed by adding the word `Trend`, `Table`, and `Treemap` to the inspect modal for each of the respective chart types, per the screenshots below: **Inspect Trend:** 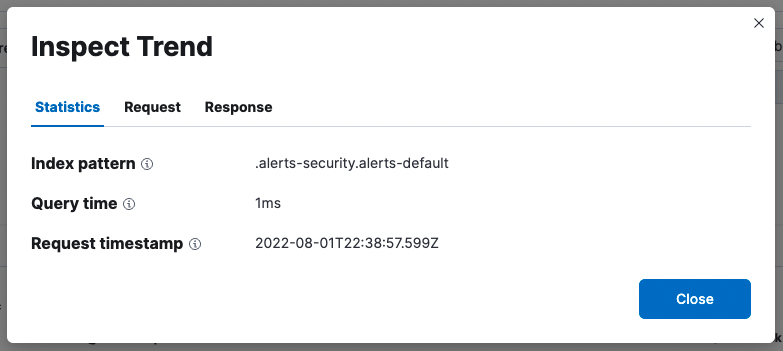 **Inspect Table:** 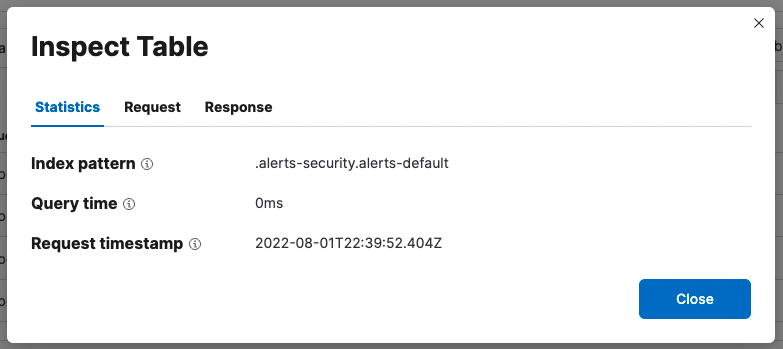 **Inspect Treemap:** 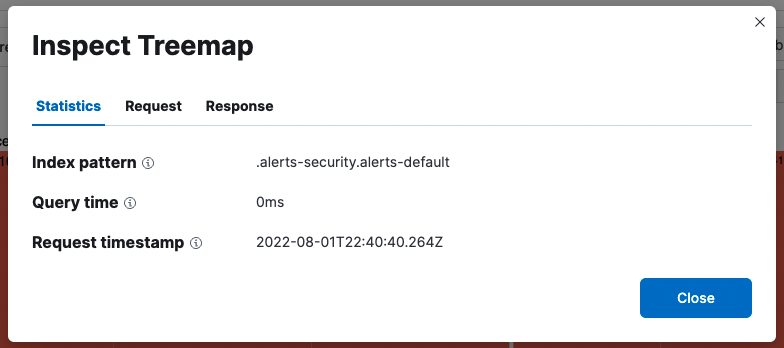 - [review feedback](elastic#126896 (review)) where the `Tree map isn't displayed for certain group by top fields, like Ransomeware.version`, was fixed as suggested by displaying an empty state message with a reason why the treemap cannot be displayed: **Before:**  **After:** 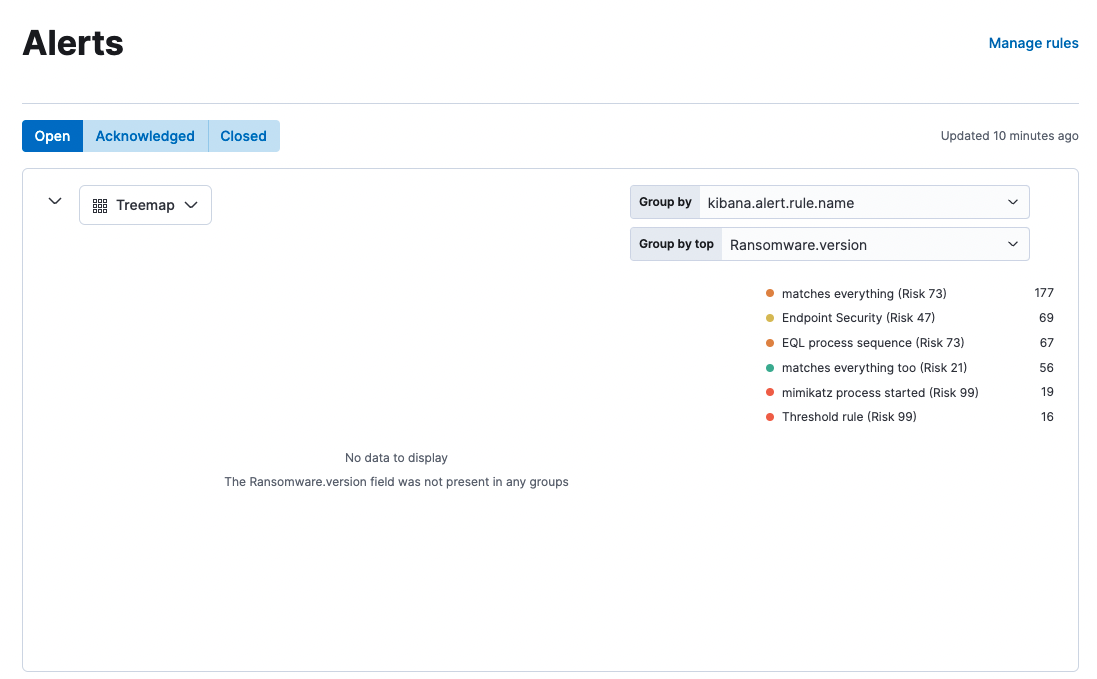 - [review feedback](elastic#126896 (review)) where there were `Extra left margins when the Table view is selected` was fixed by removing the extra margin: **Before:**  **After:** 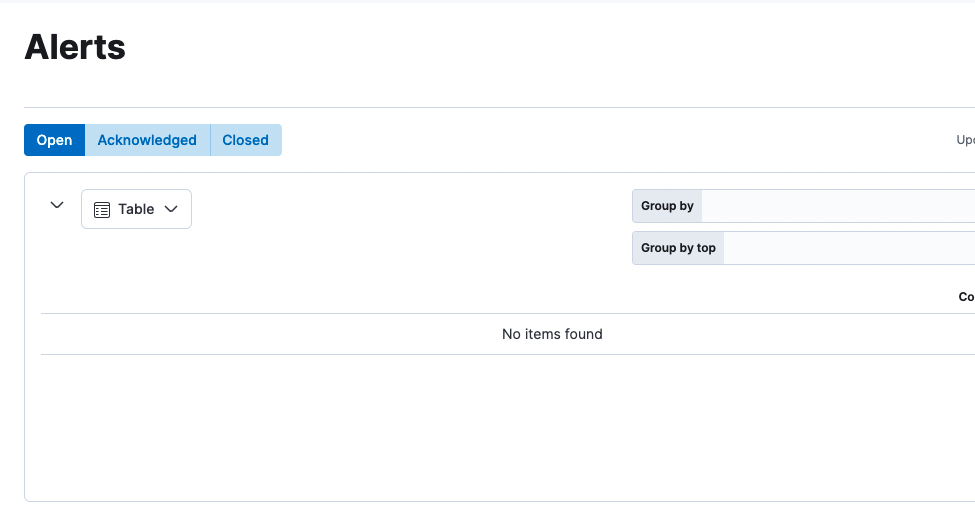
## [Security Solution] Alerts Treemap fixes This PR contains fixes for the following issues: - #136377 was fixed by using the `key_as_string` value in the search strategy response to format timestamps for the Treemap and Table views, per the screenshots below: **Treemap with timestamp formatting:**  **Table with timestamp formatting:**  - #136387 was fixed by reducing the mininum font size to `4px` for group names, per [this example](https://elastic.github.io/elastic-charts/?path=/story/treemap--two-layers-stress-test&globals=theme:light;background:white) from Elastic charts. This change: - Reduces the chances of a label getting hidden when the browser is resized, but cannot eliminate it, because at a certain point, Elastic Charts must hide the label in order to (still) render the group - Will result in some groups having very small labels where the group previously would not have them, per the screenshot below:  - #136372 was fixed by adding the word `Trend`, `Table`, and `Treemap` to the inspect modal for each of the respective chart types, per the screenshots below: **Inspect Trend:**  **Inspect Table:**  **Inspect Treemap:**  - [review feedback](#126896 (review)) where the `Tree map isn't displayed for certain group by top fields, like Ransomeware.version`, was fixed as suggested by displaying an empty state message with a reason why the treemap cannot be displayed: **Before:**  **After:**  - [review feedback](#126896 (review)) where there were `Extra left margins when the Table view is selected` was fixed by removing the extra margin: **Before:**  **After:** 
## [Security Solution] Alerts Treemap fixes This PR contains fixes for the following issues: - #136377 was fixed by using the `key_as_string` value in the search strategy response to format timestamps for the Treemap and Table views, per the screenshots below: **Treemap with timestamp formatting:**  **Table with timestamp formatting:**  - #136387 was fixed by reducing the mininum font size to `4px` for group names, per [this example](https://elastic.github.io/elastic-charts/?path=/story/treemap--two-layers-stress-test&globals=theme:light;background:white) from Elastic charts. This change: - Reduces the chances of a label getting hidden when the browser is resized, but cannot eliminate it, because at a certain point, Elastic Charts must hide the label in order to (still) render the group - Will result in some groups having very small labels where the group previously would not have them, per the screenshot below:  - #136372 was fixed by adding the word `Trend`, `Table`, and `Treemap` to the inspect modal for each of the respective chart types, per the screenshots below: **Inspect Trend:**  **Inspect Table:**  **Inspect Treemap:**  - [review feedback](#126896 (review)) where the `Tree map isn't displayed for certain group by top fields, like Ransomeware.version`, was fixed as suggested by displaying an empty state message with a reason why the treemap cannot be displayed: **Before:**  **After:**  - [review feedback](#126896 (review)) where there were `Extra left margins when the Table view is selected` was fixed by removing the extra margin: **Before:**  **After:**  (cherry picked from commit a5a7d74)
## [Security Solution] Alerts Treemap fixes This PR contains fixes for the following issues: - #136377 was fixed by using the `key_as_string` value in the search strategy response to format timestamps for the Treemap and Table views, per the screenshots below: **Treemap with timestamp formatting:**  **Table with timestamp formatting:**  - #136387 was fixed by reducing the mininum font size to `4px` for group names, per [this example](https://elastic.github.io/elastic-charts/?path=/story/treemap--two-layers-stress-test&globals=theme:light;background:white) from Elastic charts. This change: - Reduces the chances of a label getting hidden when the browser is resized, but cannot eliminate it, because at a certain point, Elastic Charts must hide the label in order to (still) render the group - Will result in some groups having very small labels where the group previously would not have them, per the screenshot below:  - #136372 was fixed by adding the word `Trend`, `Table`, and `Treemap` to the inspect modal for each of the respective chart types, per the screenshots below: **Inspect Trend:**  **Inspect Table:**  **Inspect Treemap:**  - [review feedback](#126896 (review)) where the `Tree map isn't displayed for certain group by top fields, like Ransomeware.version`, was fixed as suggested by displaying an empty state message with a reason why the treemap cannot be displayed: **Before:**  **After:**  - [review feedback](#126896 (review)) where there were `Extra left margins when the Table view is selected` was fixed by removing the extra margin: **Before:**  **After:**  (cherry picked from commit a5a7d74) Co-authored-by: Andrew Goldstein <[email protected]>
[Security Solution] Alerts Treemap and Multi-Dimensional Alert Grouping
This PR introduces the new Treemap and Multi-Dimensional Alert Grouping to the Alerts page.
The initial commit was developed as an ON week proof of concept (POC). It has since been updated to incorporate product and UX feedback.
Alerts treemap
The new Alerts page treemap is shown in the screenshot below:
Above: The new
treemapin the Alerts pagekibana.alert.rule.nameandhost.nameby defaultMulti-Dimensional Alert Grouping
The table on the Alerts page, which previously supported grouping by a single field, has also been enhanced to support multi-dimensional grouping, per the screenshot below:
Above: The table in the Alerts page, enhanced to support multi-dimensional grouping
Filtering the Alerts page by risk score
Every rule, including prebuilt Elastic rules and custom rules created by users, must specify a risk score at rule creation time, per the screenshot below:
Above: Every rule has a risk score specified when it's created
The colors of the alerts displayed in the treemap are determined by the rule's risk score. This makes it easy to quickly filter the entire alerts page by clicking on the riskiest alerts.
Clicking on a cell in the treemap adds two filters, one for each group by field, per the screenshot below:
Above: Two filters, (one for each group by field), are added to the page when a cell is clicked
The Alerts page updates instantly when filters are added or removed. In the screenshot below, the 2nd filter was removed to filter the page to all
mimikatz process startedalerts:Above: Removing the 2nd filter, a specific
host.name, revealed all the hosts in themimikatz process startedalertsSwitching views
Users may switch between the following views:
per the screenshot below:
Above: View selection
The default Trend view is shown in the screenshot below:
Above: The (default) Trend view
The Trend chart's legend has been enhanced to display counts, per the design detailed in issue [Security Solution] Suggestion. Collapse Alerting graphs into one view #120282
The Trend view only supports visualizing a single dimension. Hovering over the disabled
Group by topselect in the Trend view displays the tooltip shown in the screenshot below:Above: The Trend view only supports visualizing a single dimension
Collapsing the panel
The panel may optionally be collapsed to save space, per the screenshot below:
Above: The panel (optionally) collapsed
User preferences are persisted to local storage
Previously, the Group by selections on the Alerts page were always forgotten when users navigated away from the Alerts page. As a result, users had to re-select their preferred Group by fields every time they visited the page.
We now store all of the following preferences in local storage:
The preferences above are now restored the next time users return to the Alerts page.
Group by field selection is synchronized between views
Group by field selection is synchronized between views. For example, if a user changes the Group by fields in the Treemap view and then switches to the Table view, the same Group by fields will be displayed in the Table view.
Resetting Group by fields to their defaults
Users may reset the Group by fields to their defaults (
kibana.alert.rule.nameandhost.name) for any visualization via the menu shown in the screenshot below:Above: Resetting Group by fields to defaults via the menu