When we try to use the application in caffe to generate the graphs about our training acc or loss, we failed. So we decided to make a new one. It can help us draw the graphs.
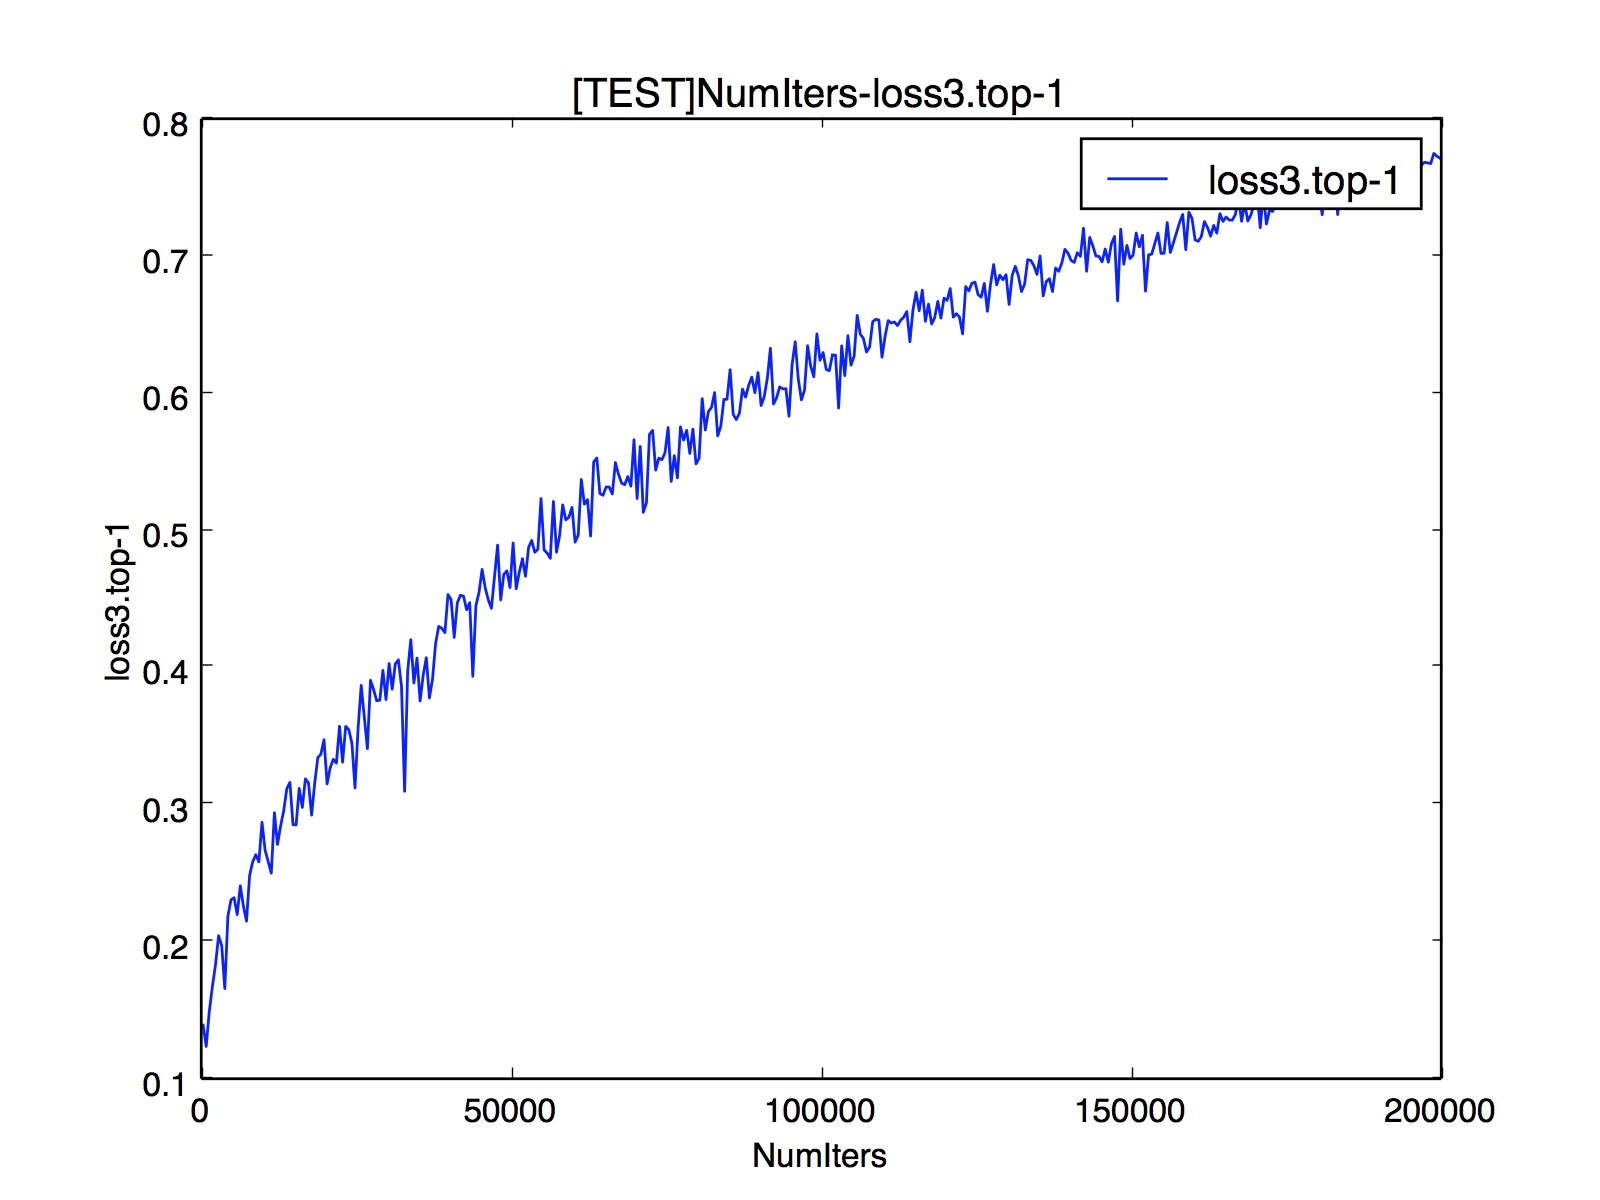
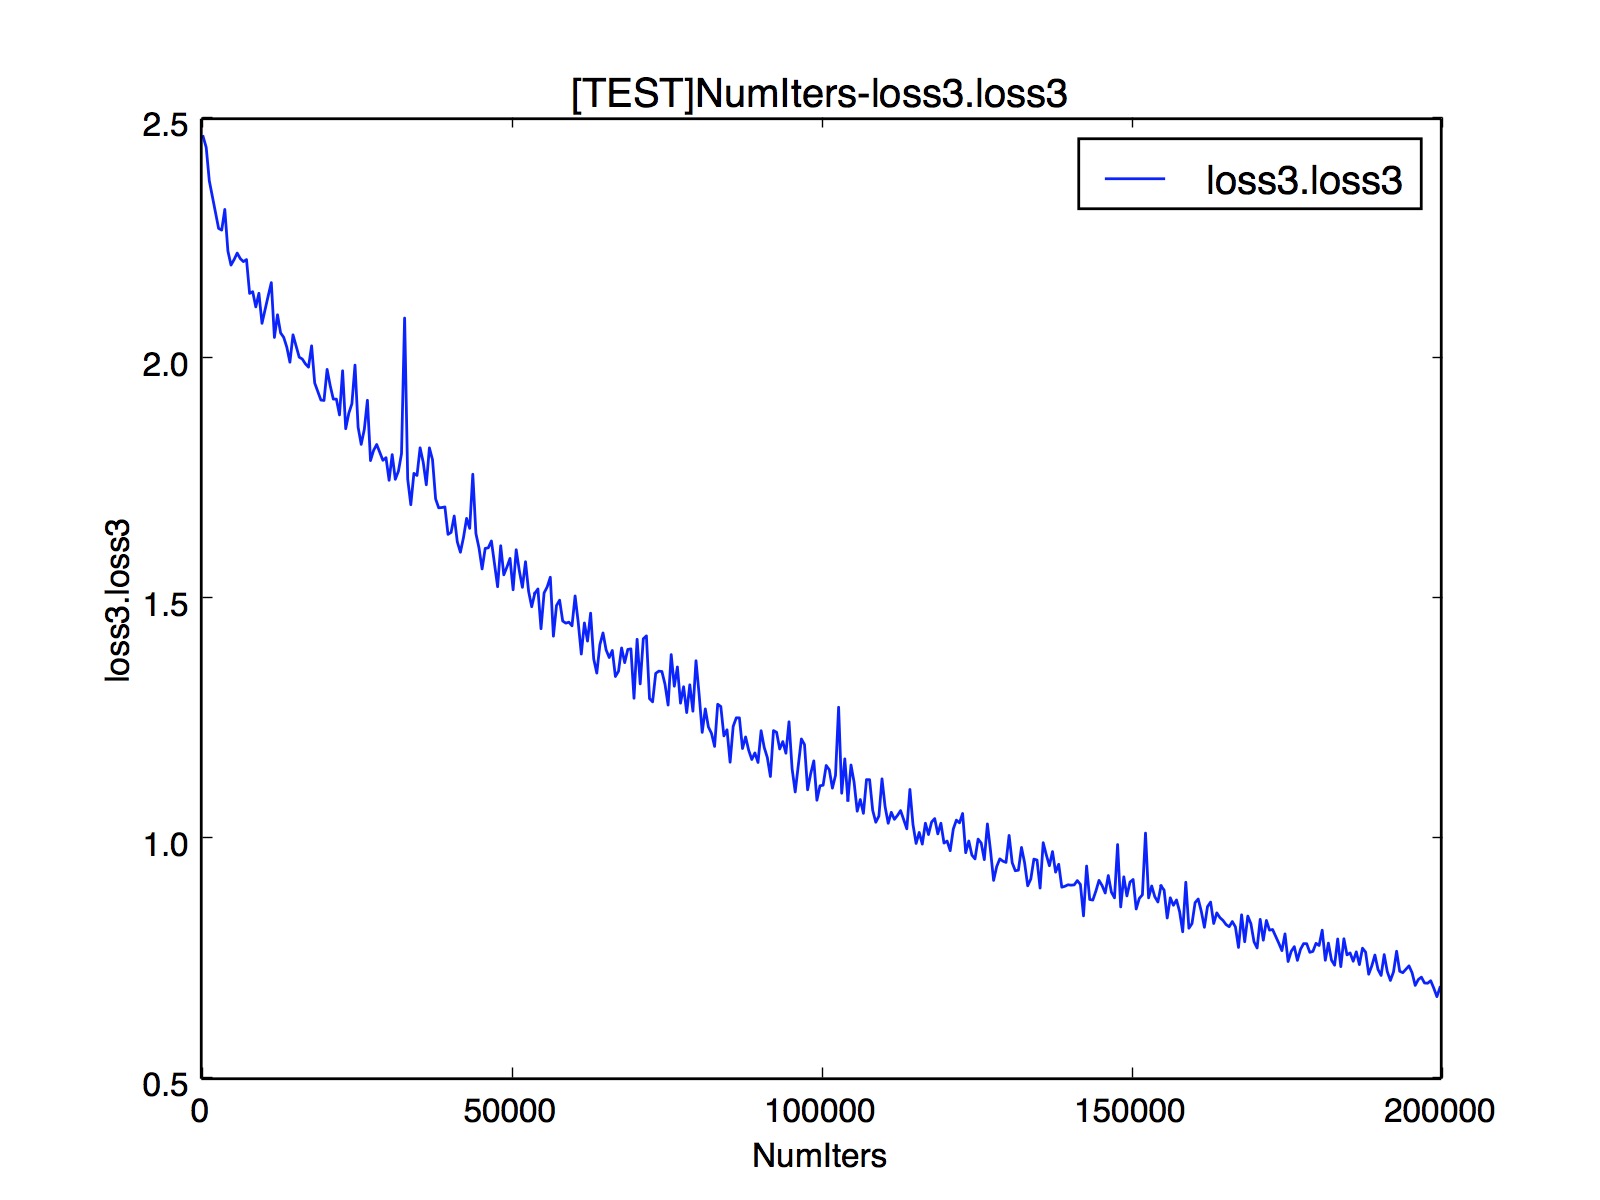
These are the graphs about googLeNet training. They are in the log_example folder, so you can try it.
Python 2.7.x pycaffe
$TOOLS/caffe train --solver=$SOLVERFILE 2>&1 |tee out.log
# cd /path/to/your/caffe/
# git clone https://github.com/GDUTCPSDL/caffe_draw.git
Modify caffe_draw/draw.sh
# chmod +x ./caffe_draw/draw.sh
# ./caffe_draw/draw.sh
Then you will find graphics in the directory where log file is.