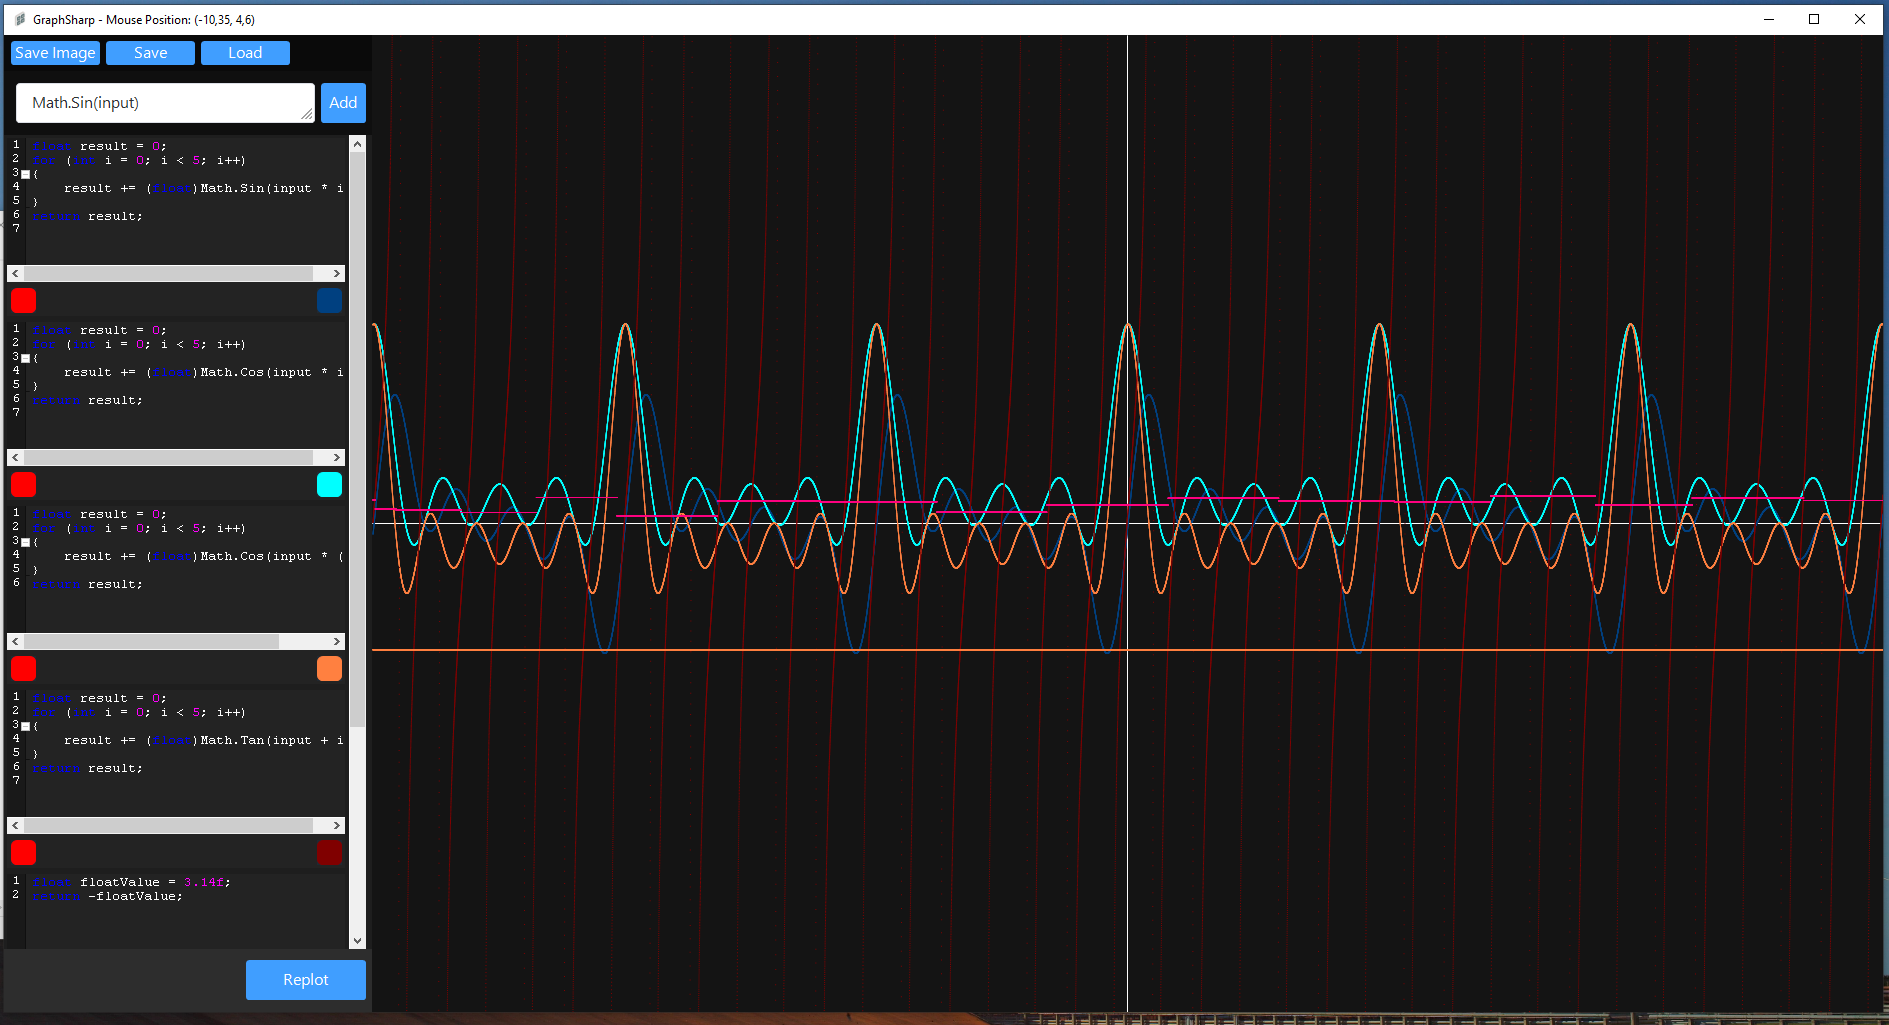
GraphSharp is a Windows Forms application for plotting mathematical functions. It allows users to input mathematical expressions and visualize the corresponding graphs.
- Plot custom mathematical functions
- Adjustable scale for the x and y axes
- Dynamic graph updating
- Save and load graphs in JSON format
- Export graphs as PNG images
To run the application, follow these steps:
- Clone the repository:
git clone https://github.com/your-username/GraphSharp.git - Open the solution in Visual Studio.
- Build the solution to restore NuGet packages.
- Run the application by pressing F5.
Or get the latest release, unzip it and run GraphSharp.exe!
- Enter a mathematical expression in the input box.
- Click the "Add Plot" button to add the function to the graph.
- Adjust the scale of the graph using the provided controls.
- Click the "Redraw" button to update the graph.
- Use the mouse to explore the graph by hovering over points.
- Save the graph as a PNG image by clicking the "Save as PNG" button.
- Save the graph configuration as a JSON file by clicking the "Save as JSON" button.
- Load a graph configuration from a JSON file by clicking the "Open JSON" button.
The application supports two types of mathematical expressions:
-
Single-line Expression:
- This type of expression should directly return the result of the mathematical calculation.
- Example:
x => 2 * x + 3
-
Multi-line Expression:
- This type of expression allows for more complex calculations by using additional statements.
- Example:
 float result = 0;
 for (int i = 0; i < 5; i++)
 {
     result += (float)Math.Sin(x * i);
 }
 return result;
- Note: Make sure to include the
returnstatement in the multi-line expression to specify the result.
You can also download a demo.json project here
- .NET Framework 4.7.2 or later
- Newtonsoft.Json (version x.x.x)
- System.Drawing (version x.x.x)
- System.Windows.Forms (version x.x.x)
- Microsoft.CodeAnalysis (version x.x.x)
This project is licensed under the MIT License.