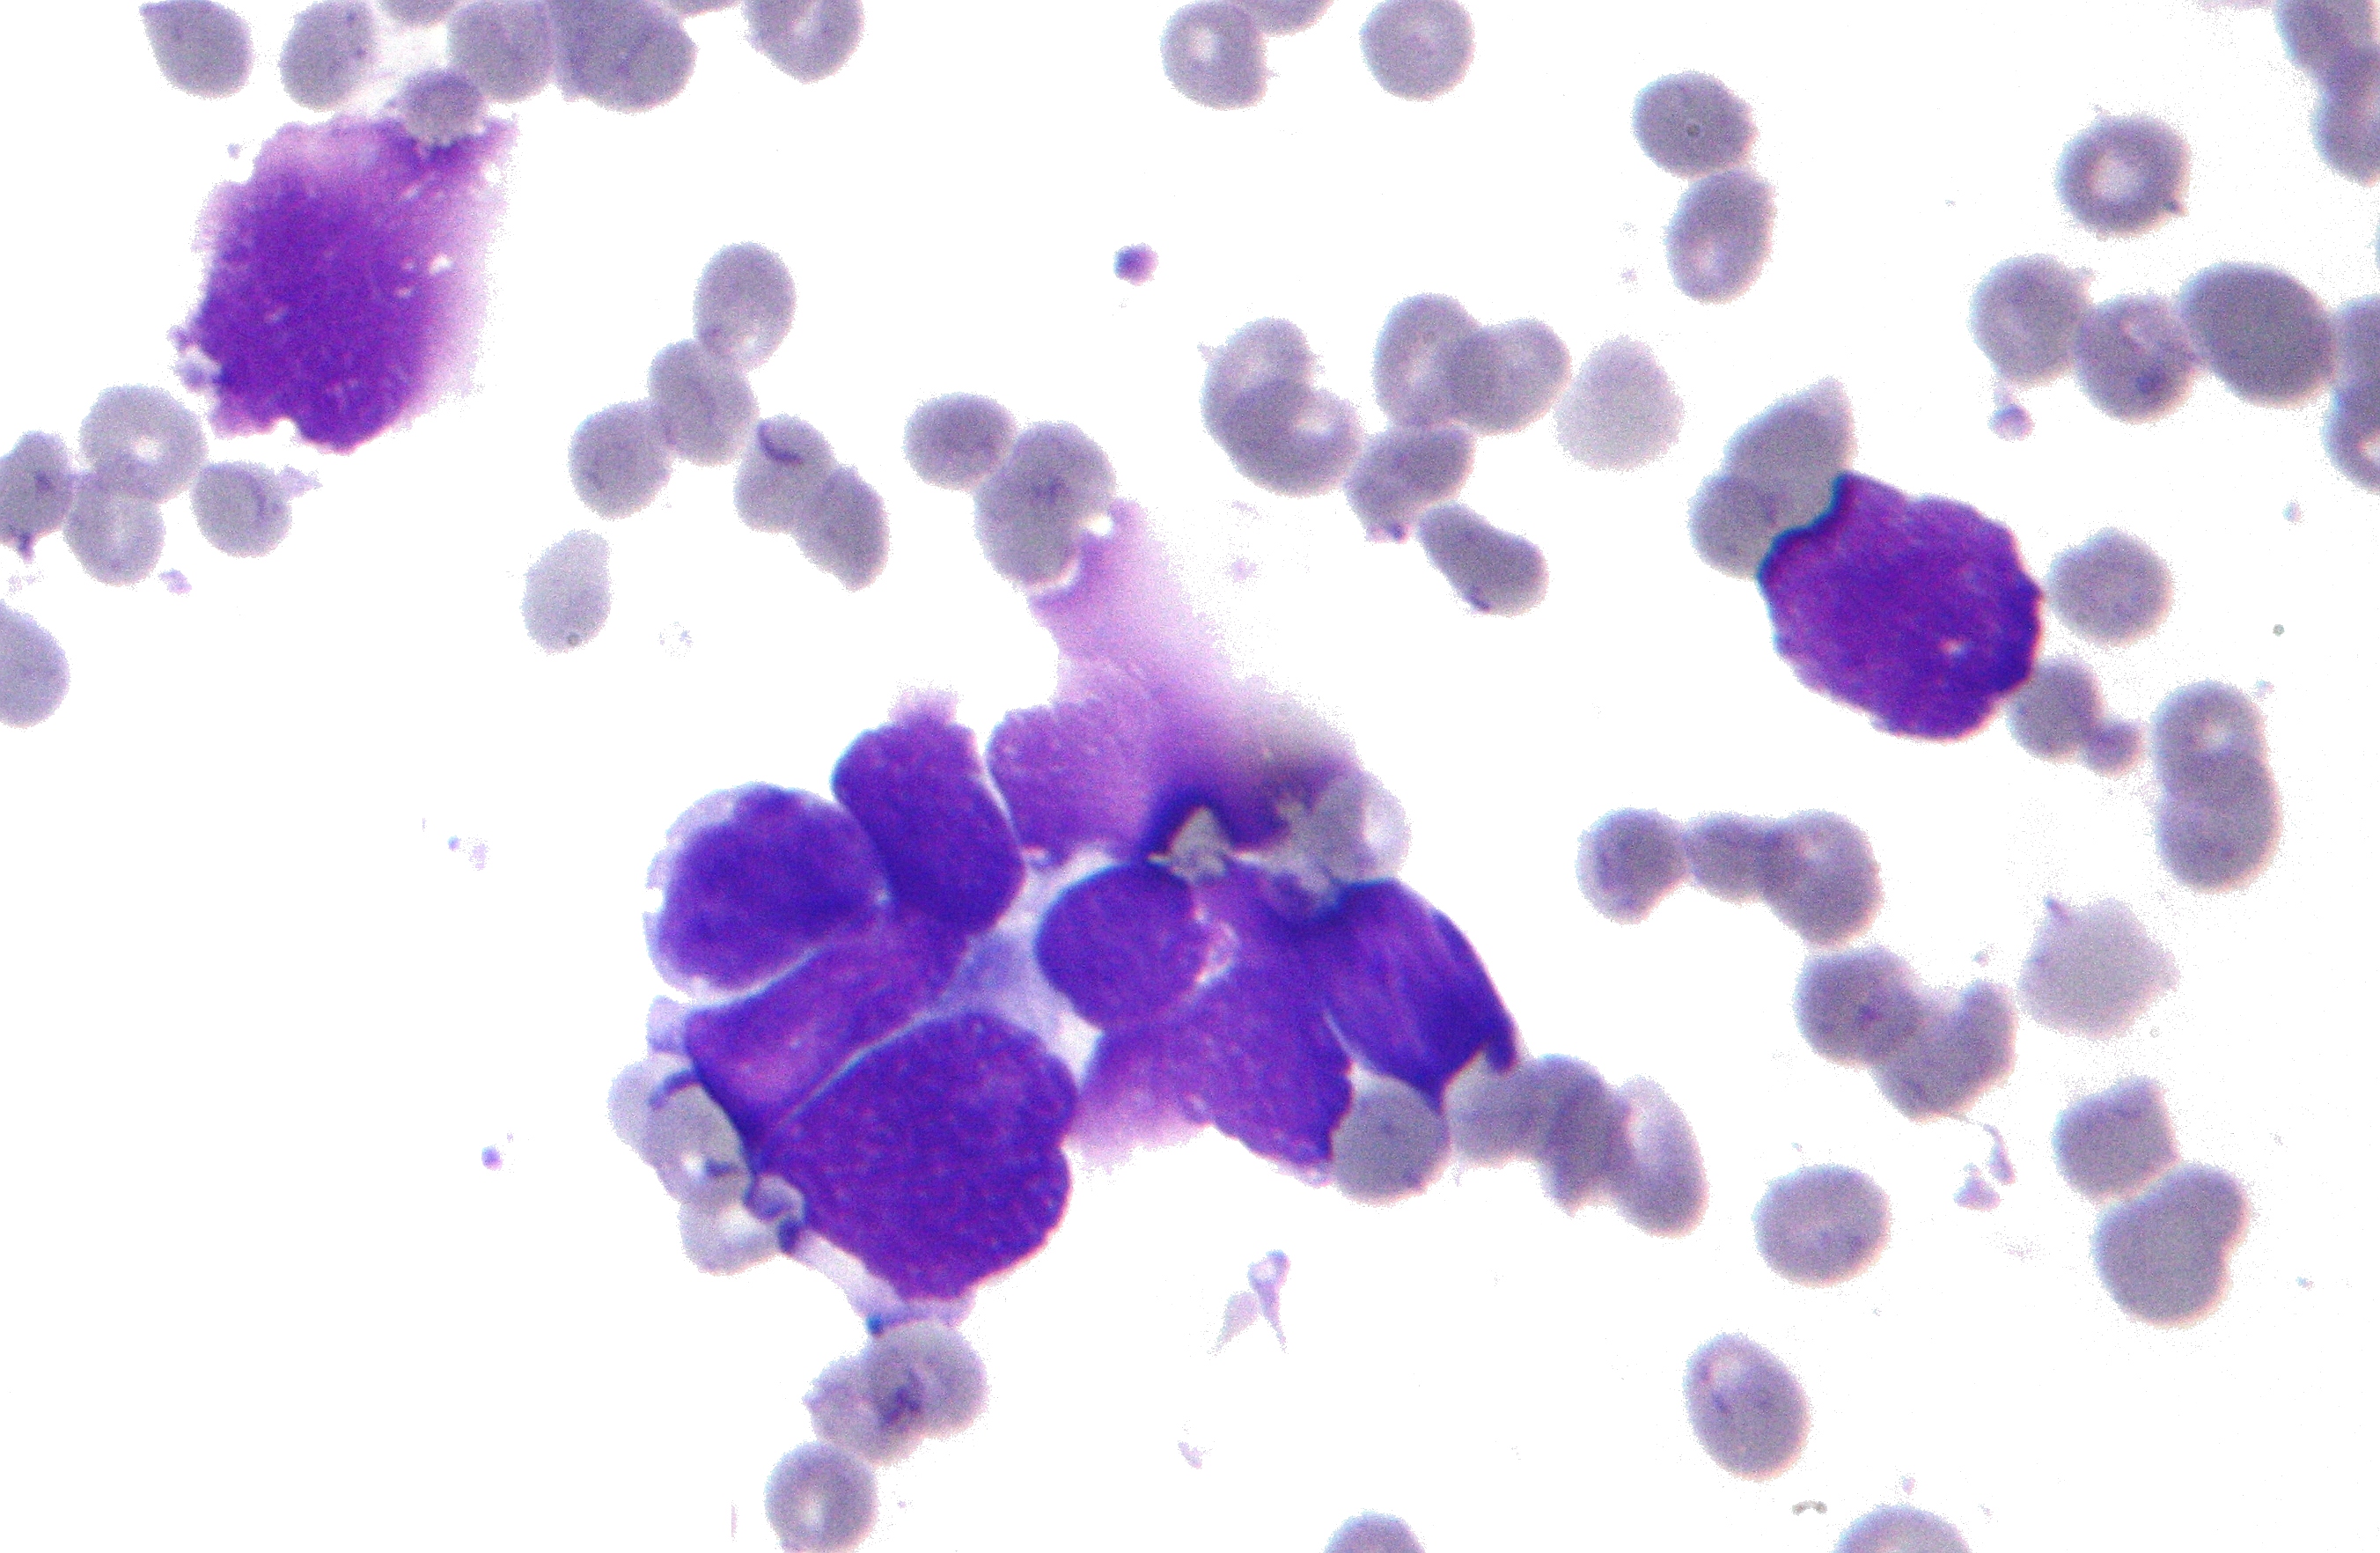
The data can be found on UCI Machine Learning Repository: http://archive.ics.uci.edu/ml/datasets/breast+cancer+wisconsin+(diagnostic)
- ID number
- Diagnosis (M = malignant, B = benign)
- 30 Features
Ten real-valued features are computed for each cell nucleus:
- radius (mean of distances from center to points on the perimeter)
- texture (standard deviation of gray-scale values)
- perimeter
- area
- smoothness (local variation in radius lengths)
- compactness (perimeter^2 / area - 1.0)
- concavity (severity of concave portions of the contour)
- oncave points (number of concave portions of the contour)
- symmetry
- fractal dimension ("coastline approximation" - 1)
The mean, standard error and "worst" or largest (mean of the three largest values) of these features were computed for each image, resulting in 30 features. For instance, field 3 is Mean Radius, field 13 is Radius SE, field 23 is Worst Radius.
All feature values are recoded with four significant digits.
Missing attribute values: none
Class distribution: 357 benign, 212 malignant
