This is the most basic type of monitoring. Only most basic data is collected and analyzed - "Response Time", "Status Code", "Uptime".
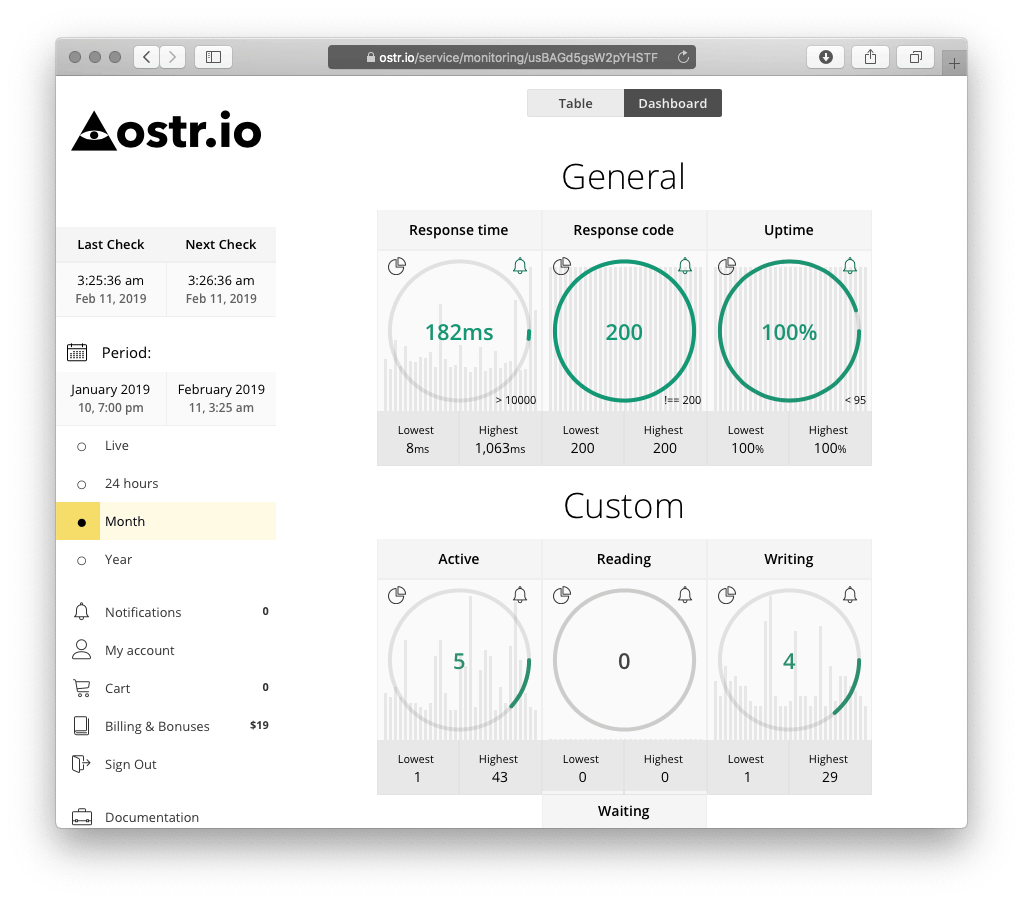
Return custom data from endpoint as JSON or XML to parse it into charts with notifications triggers.
{
  "active": 98,
  "reading": 0,
  "writing": 55,
  "waiting":43
}<data>
<active>98</active>
<reading>0</reading>
<writing>55</writing>
<waiting>43</waiting>
</data>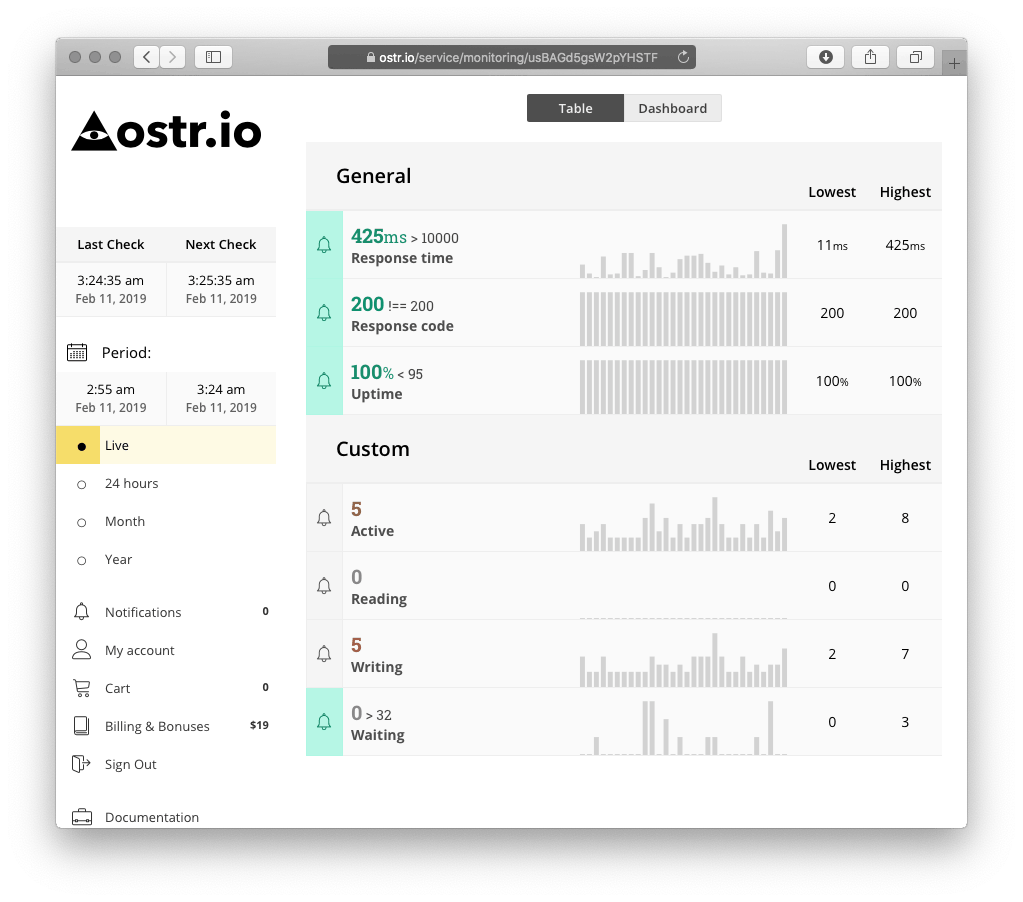
SNMP monitoring also known as "Health Monitoring", where a lot of data is collected, including but not limited to: "SSH Sessions", "CPU Consumption", "Storage Space Utilization", "Network Consumption", "RAM Usage", "System Load", "Uptime" and etc. Read how to configure and enable SNMP monitoring.