All nodes which are allocated for this job are already filled #23
Comments
|
@IstrateRoxana This message shows up when the allocated slots are fewer than the slots started by mpirun. You can try with Also you may want to check the parallel loading process is spawned on the same hostname here as training process in the display-allocation list. Since ResNet50 trains on ImageNet and ImageNet training needs an additional parallel loading process to accelerate loading and preprocessing. If you also want to see the exact binding of each core, try enable by adding report-binding option to mpirun command. |
|
I managed to sove it, it was nothing related to the framwork, more with my internal node scheduler. Is theano-mpi tested with python3? Or python2 only? |
|
@IstrateRoxana The code was developed on python2. Recently, I added python3 support and debugged some syntax problems. You should be able to run with python3 now. Let me know if you have problems on that. |
|
Hi, I managed to run up to some point and i discovered these things:
Have you had this warning before?
To answer this i first need to know how thinks work inside the framework, so I split this question above into more smaller pieces. a. The batch_size that is set in resnet50.py is the batch_size per gpu or per all gpus? E.g if I use 4 GPUS, the actual batch size is 4*the batch_size paramater here: https://github.com/uoguelph-mlrg/Theano-MPI/blob/master/theanompi/models/lasagne_model_zoo/resnet50.py#L204? In which part of the code can I measure how much time is spent per bach size per device? b. What is E.g I ran the theano_alexnet script in the imagenet.py i set the train_dir = train_hkl_b128_b_128.0 and val_dir = val_hkl_b128_b_128.0. From my understanding now I think the file_batch_size should be 128 and the batch_size should be 32, am I correct? However, if I run the test_bsp.py with 4 GPUs I always get a The exact same data but only 2 GPUs works up to a few epochs. |
|
@IstrateRoxana Thanks for reporting those.
|
|
Hei, many thanks for the answer, however I updated the point 5 in the meantime, can you also check that one? Many thanks again!! |
|
@IstrateRoxana b. Yes, If you generate data batches successfully using the preprocessing script from a. If you have more files, then the training goes through more iterations every epoch. For every 5120 images (that is 40 batches of 128), the training will print timing here. |
|
Indeed, i only generated a toy dataset with only 10 batches. What is still not clear from your answer is whether the batch_size is per gpu or not. My setting has file_batch_size = 128, which is the number of images in one .hkl file. But batch_size = 32. In this case each gpu processes 32 images? Or each gpu processed 32/4=8 images, considering I am running on 8 GPUs? |
|
@IstrateRoxana Forgot to answer this question. |
|
@IstrateRoxana The |
|
All clear now, many many thanks! |
|
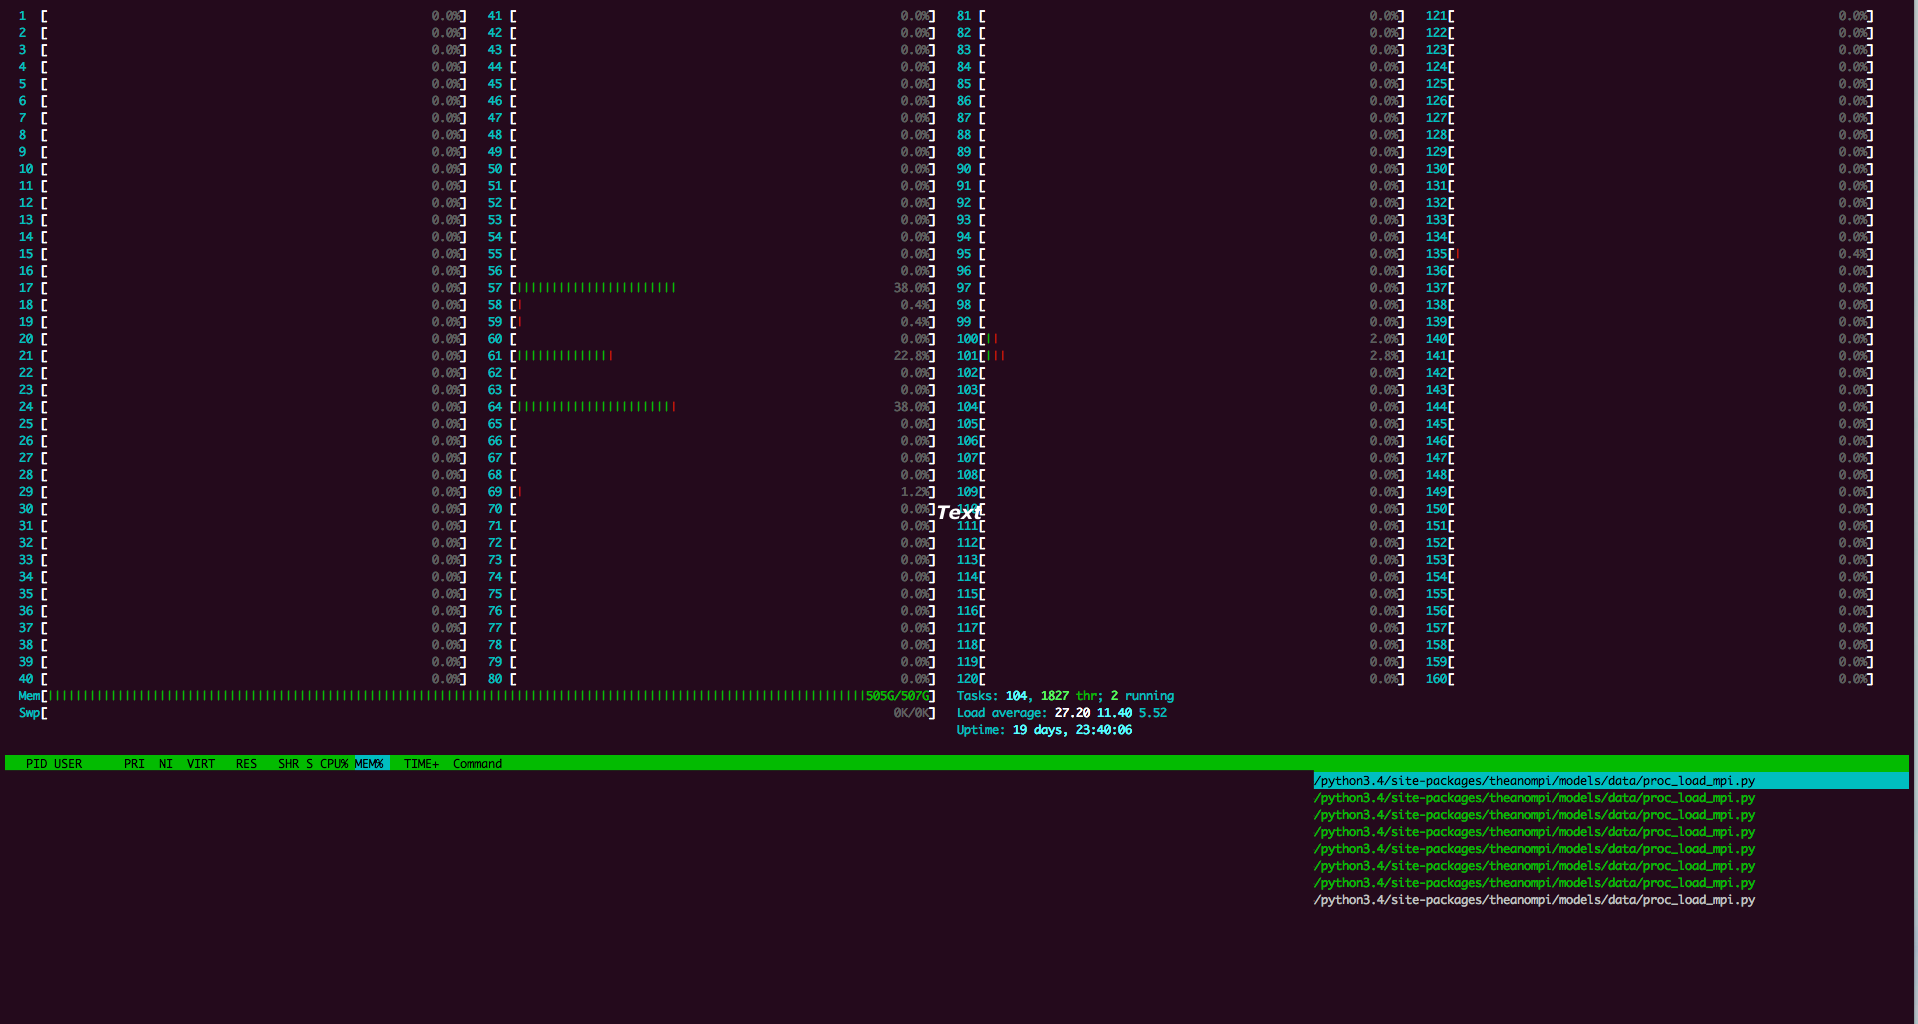
I discovered a new problem, which is practically the reason of seg faults. 1st BUG: During training of I tried to find the bug but so far with little success. Maybe you can help with this. My dataset comprises 50 batches of 128 images each. The hkl train folder is 1.2 GB, so there should be no problem in loading it to memory, so I am not sure how 500GB of RAM get filled in a few minutes. The memory growth starts during the compilation of the functions. And this is how it ends after only a few epochs (2GPUs and batch_size 64) after only 6 epochs:
Also, although the I changed para_loading to False to check if works and I found a 2nd BUG: When using para_loading =False, it fails with You forgot to import hickle in resnet50.py Also this method overflows the GPU memory. So how can I solve the memory filling with while having para_load=True? |
|
@IstrateRoxana Okay. Let me try reproducing your situation on our Minsky. I will get back to you later. |
|
Sure. Tell me if you need more information. |
|
@IstrateRoxana For some reason I got into a different problem with hickle. I wonder if it is due to the fact that I preprocessed images using python2 version of hickle, but now trying to load it using python3 version of hickle. Maybe I need to ask @telegraphic those guys. See this log file. Have you tried using python2? |
|
I used hickle with python3, the dev version and it worked. I cannot test with python2, my theano is installed for python3 and i am not the root of the systems, therefore i cannot test this unfortunately.. I had the same problem as you have now, just install hickle dev version, it works with python3 |
|
@IstrateRoxana I see. Do you have any log file of your seg faults? There was another issue #21 related to python3 and seg faults. It was about updating Theano to the bleeding edge. Have you tried adding a local export PYTHONPATH=~/.local_minsky/lib/python2.7/site-packages/
export PATH=$PATH:~/.local_minsky/bin
export CPATH=$CPATH:~/.local_minsky/include
export LIBRARY_PATH=$LIBRARY_PATH:~/.local_minsky/lib
export LD_LIBRARY_PATH=$LD_LIBRARY_PATH:~/.local_minsky/liband installing all packages (theano, hickle, mpi4py, theanompi) locally? For example $ python2 setup.py install --prefix=~/.local_minsky |
|
We have the bleeding edge Theano and Lasagne. To be honest no, i didn't try yet, and I am preparing some results for a poster which has a deadline in 1 week and 3 days so I am not sure I have time to reinstall everything. If you find what is filling the memory that bad (i guess is a bug in the |
|
@IstrateRoxana Okay. I haven't got into the situation of "too many loading processes" problem yet. My guess is that the job scheduler failed to kill some zombie process left over by last run. Not sure about the exceeded host memory issues though and this issue may cause the scheduler to kill the python process causing a Do you have access to run job interactively, e.g., submit an interactive slurm job and go inside the node and start the job. Also it's recommended to start the job with
|
|
I have access to run a job interactively. Before all runs i make sure there is no zombie, i actually kill all python processes. All jobs start from 20GB RAM which is how much the system needs to correctly run the queueing system and all other default services, so no other old zombies are using the memory. I also check with htop how is the memory consumption evolving and always as soon as the first Spawn is called with the I tried running |
in models: alexnet, googlenet, resnet50, vgg16
|
@IstrateRoxana Okay. I guess now more test needs to be done in python3 to reproduce those memory and extra process issues. Yeah, your are right. This bash script needs to be re-designed with python3 in mind. Now, perhaps a quick hack can be alias python='python3'Or replacing the five |
|
Hehe, nice trick. I will try tomorrow and let you know.
…On Thu, 20 Jul 2017 at 23:09, He Ma ***@***.***> wrote:
@IstrateRoxana <https://github.com/istrateroxana>
Okay. I guess now more test needs to be done in python3 to reproducing
those memory and extra process issues.
Yeah, your are right. This bash script needs to be re-designed with
python3 in mind.
Now, perhaps a quick hack can be
alias python='python3'
—
You are receiving this because you were mentioned.
Reply to this email directly, view it on GitHub
<#23 (comment)>,
or mute the thread
<https://github.com/notifications/unsubscribe-auth/ADyiqcIL61zz7PRlUxYWwVsT3Ne_gQrPks5sP8ISgaJpZM4ObRnh>
.
|
|
After changing all python to python3 in tmlauncher script I get this error Which doesn't appear when running with python3 directly |
|
@IstrateRoxana As I said earlier, this is probably due to undersubscribed slots when using $ cat my-hosts
zhcc015 slots=4 max_slots=160
anothernode slots=4 max_slots=160to increase the number of subscribed slots. So that whenever an additional process needs to be spawned during program lifetime, there's free slots to do so.
I recommend doing the first check first: turn on Also I kind of suspect your mpirun command is not from the same openmpi library as linked with mpi4py, because of the different behaviours between using |
|
Is it possible that with ResNet50 1GPU (Nvidia P100), batch size 32, i get these timings? if we compute the number of images/sec is 40 * 32 / 47.23 = 27.1 images/sec, while with TensorFlow 1 gpu, same batch_size, i get 140.44 images/sec. Am I doing something wrong? |
|
@IstrateRoxana
Yes. Similar to my benchmark on one P100.
… On Jul 24, 2017, at 11:14, IstrateRoxana ***@***.***> wrote:
Is it possible that with ResNet50 1GPU, batch size 32, i get these timings?
model size 24.373 M floats
loading 40958 started
compiling training function...
compiling validation function...
Compile time: 230.488 s
40 7.605549 0.998828
time per 40 batches: 48.80 (train 48.68 sync 0.00 comm 0.00 wait 0.12)
validation cost:7.6619
validation error:0.9984
validation top_5_error:0.9930
weights saved at epoch 0
global epoch 0 took 0.0141 h
40 7.601627 0.998828
time per 40 batches: 47.23 (train 47.14 sync 0.00 comm 0.00 wait 0.09)
validation cost:7.6594
validation error:0.9984
validation top_5_error:0.9938
global epoch 1 took 0.0136 h
40 7.603139 0.998633
time per 40 batches: 47.73 (train 47.60 sync 0.00 comm 0.00 wait 0.13)
if we compute the number of images/sec is 40 * 32 / 47.23 = 27.1 images/sec, while with TensorFlow 1 gpu, same batch_size, i get 140.44 images/sec. Am I doing something wrong?
Roxana
—
You are receiving this because you commented.
Reply to this email directly, view it on GitHub, or mute the thread.
|
|
What is it the bottleneck in this? |
|
@IstrateRoxana Do you mean the speed bottleneck of single GPU training? That would be attributed to the speed of Theano and cuDNN I assume, since Theano-MPI just wraps theano functions inside. For multiple GPU training, the speed bottleneck of Theano-MPI are synchronization between GPUs and inter-GPU communication. See the 4GPU ResNet training log here on a IBM Power8 Minsky. The synchronization overhead comes from the execution speed difference between GPUs. The communication overhead is related to the inter-GPU transfer bandwidth and NUMA topology (crossing SMP/QPI is needed when using 4GPU). Hopefully it can be faster if NCCL2 is incorporated when it comes out. The convergence bottleneck as mentioned in the Facebook paper (#22) is due to the optimization difficulty and generalization error when using large batch SGD. |
|
But when running a training on the same architecture, 1 gpu, 32 batch size, pure theano I can process 100 images in below 2 seconds, going to 73 images/second. I meant, in which part is theano-mpi adding so much overhead? |
|
@IstrateRoxana Sorry, I just saw your calculations
So the time here is per 40 * 128 batch, as can be seen here, while batch_i <model.data.n_batch_train:The So the timing is per 40 * 128=5120 images. 40*128/ 47.23 = 4 * 27.1 images/sec. You can also check some other benchmark in this notebook. |
|
But if my batch size is 32, why do you multiply by 128?
…On Mon, 24 Jul 2017 at 19:28, He Ma ***@***.***> wrote:
@IstrateRoxana <https://github.com/istrateroxana>
Sorry, I just saw your calculations
if we compute the number of images/sec is 40 * 32 / 47.23 = 27.1
images/sec, while with TensorFlow 1 gpu, same batch_size, i get 140.44
images/sec. Am I doing something wrong?
So the time here is per 40 * 128 batch, as can be seen here
<https://github.com/uoguelph-mlrg/Theano-MPI/blob/master/theanompi/worker.py#L72>
,
while batch_i <model.data.n_batch_train:
The batch_i corresponds to a file batch.
So the time is per 40*128=5120 images. 40*128/ 47.23 = 4*27.1 images/sec.
—
You are receiving this because you were mentioned.
Reply to this email directly, view it on GitHub
<#23 (comment)>,
or mute the thread
<https://github.com/notifications/unsubscribe-auth/ADyiqbiTv_K95jKqFIMRHUWDYvgMrbPfks5sRNRSgaJpZM4ObRnh>
.
|
|
@IstrateRoxana The timing code here is designed to be while batch_i <model.data.n_batch_train:
for subb_i in range(model.n_subb):
model.train_iter(batch_i, recorder)
if exch_iteration % exchange_freq == 0:
exchanger.exchange(recorder)
exch_iteration+=1
batch_i+=1
recorder.print_train_info(batch_i*self.size)So the info here that prints is actually per file, and the |
in models: alexnet, googlenet, resnet50, vgg16
I get this weird message when I try to run examples/test_bsp.py on a 4GPU machine:
Things that I already verified:
2MiB / 16276MiBMemory usage, and 0% Utilisation.devices=['cudaX'], where X in {0,1,2,3}.Any idea how to fix this?
The text was updated successfully, but these errors were encountered: