
Network-wide ad blocking via your own Linux hardware
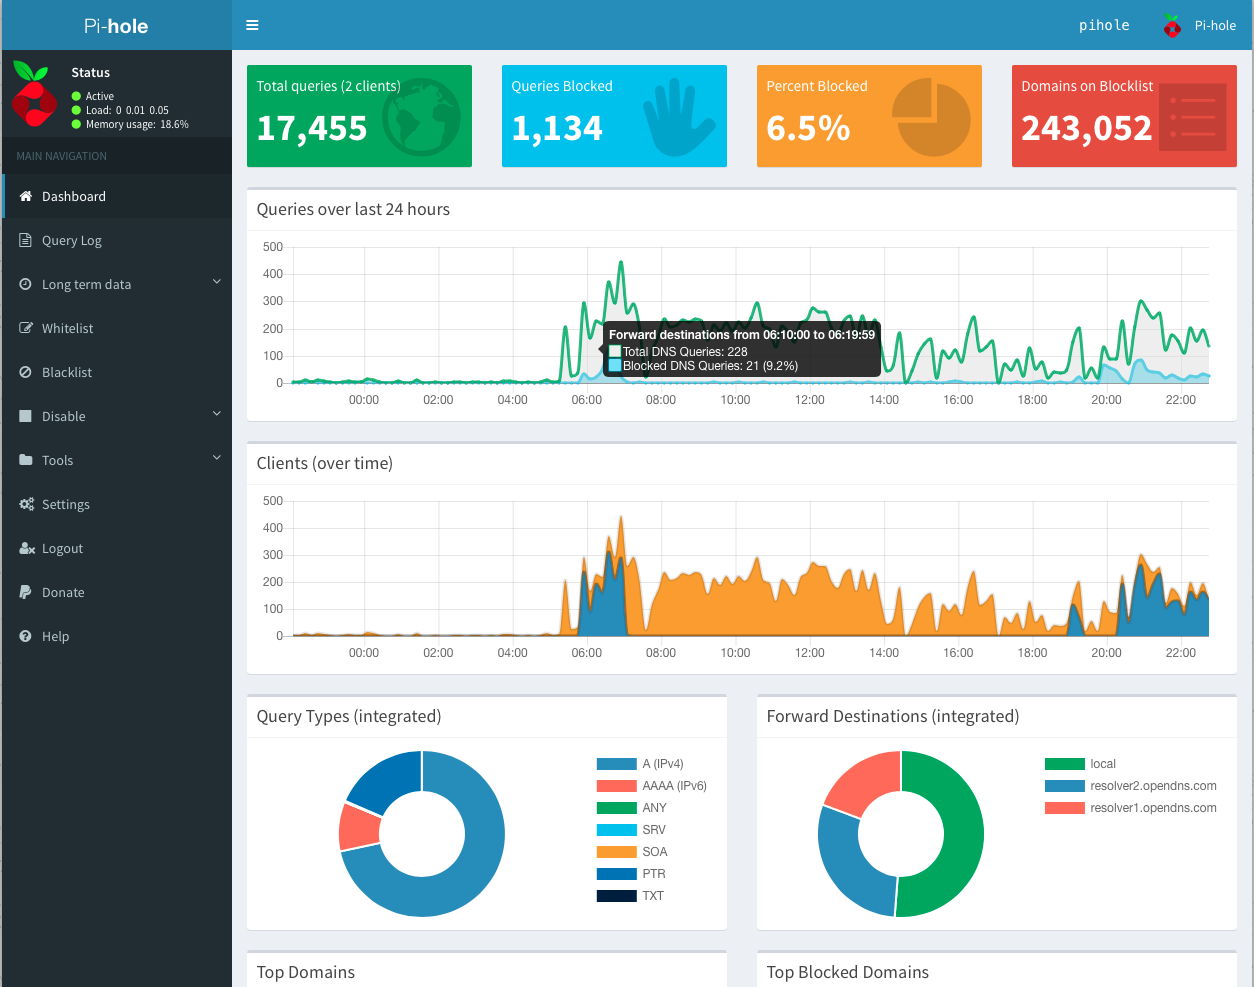
Pi-hole®'s Web interface (based off of AdminLTE) provides a central location to manage your Pi-hole and review the statistics generated by FTLDNS™.
- Easy-to-interpret: simple graphs and beautiful colors make Pi-hole's stats easy to understand
- Responsive: looks great on desktop, tablets, and mobile devices
- Useful: control and configure your Pi-hole with our settings
- Insightful: use the query log, audit log, or long-term stats to gain insight into your networks activity
The Web interface is enabled by default when you install Pi-hole.
There are several ways to access the dashboard:
http://<IP_ADDPRESS_OF_YOUR_PI_HOLE>/admin/http:/pi.hole/admin/(when using Pi-hole as your DNS server)http://pi.hole/(when using Pi-hole as your DNS server)
Once logged in (forgot your password?), you can view your network stats to see things like:
- the domains being queried on your network
- the time the queries were initiated
- the amount of domains that were blocked
- the upstream server queries were sent to
- the type of queries (
A,AAAA,CNAME,SRV,TXT, etc.)
There are many reoccurring costs involved with maintaining free, open source, and privacy respecting software; expenses which our volunteer developers pitch in to cover out-of-pocket. This is just one example of how strongly we feel about our software, as well as the importance of keeping it maintained.
Make no mistake: your support is absolutely vital to help keep us innovating!