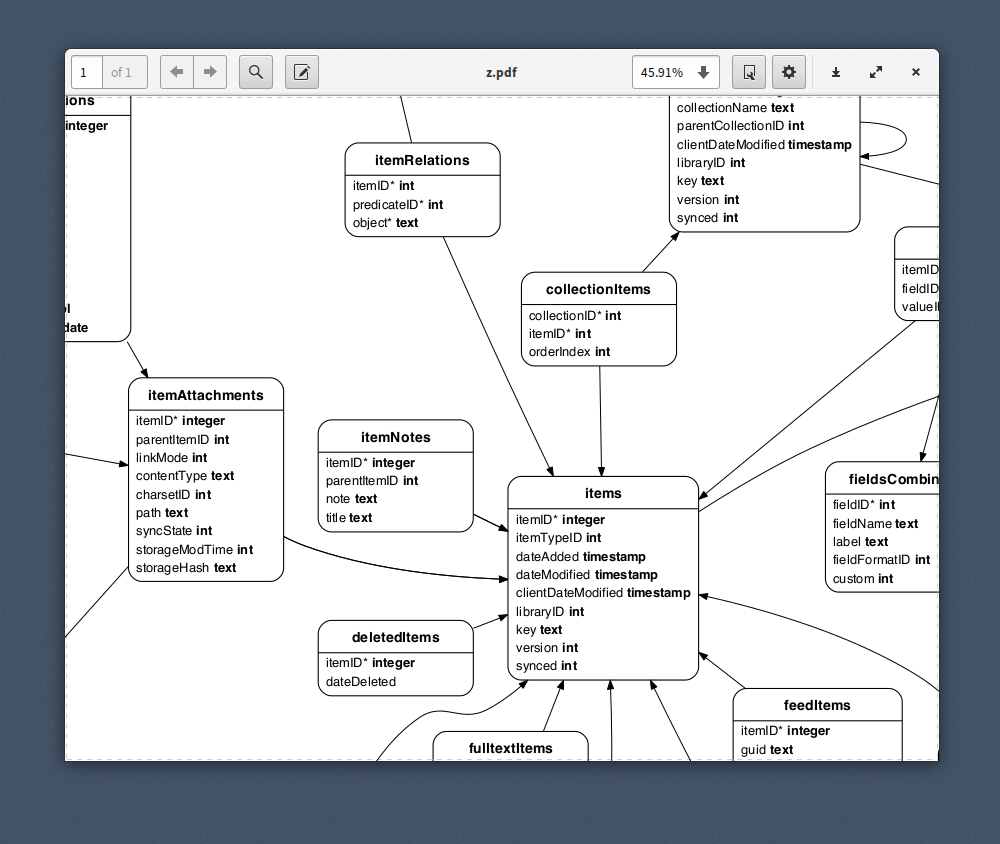
Visualizes your SQLite database schema.
$ npm install -g sqletonYou need to install graphviz separately:
$ [pacman -Sy | apt-get install | brew install] graphviz$ sqleton -o db.svg db.sqliteThe format will be inferred from the name of the output file; you
can use any format supported by graphviz (png, pdf, svg, and many more).
Usage: sqleton [options] <db-file>

Options:
  -h, --help        Print this help text and exit
  -v, --version     Print program version and exit
  -L, --layout      The layout command, one of:
                      "neato", "dot", "circo",
                      "fdp" (default),
                      "osage", "sfdp", "twopi"

  -e, --edge-labels  Label foreign key edges
  -t, --title        Optional title string
  -f, --font         The font to use, by default "Helvetica"
  -d, --direction    Graph direction, "TB" or "LR" (default)
  -o, --out          Output file (determines output format)
                     if not given DOT will be printed to stdout

      --skip-index   Skip writing table indexes
To fine-tune your graph, the best option is to use .dot as your output
format and adjust the parameters in the file.
const sqleton = require('sqleton')

// Open your database and writable stream
// ....

sqleton(db, stream, options)
  .then(() => { db.close() })
.then(() => { stream.end() })sqleton was written to visualize SQLite schemata. Having said that,
you can try to dump your schema and create a new SQLite database for
visualisation from it.