Skip to content
New issue

Have a question about this project? Sign up for a free GitHub account to open an issue and contact its maintainers and the community.

By clicking “Sign up for GitHub”, you agree to our terms of service and privacy statement. We’ll occasionally send you account related emails.

Already on GitHub? Sign in to your account

Stacked bar chart with both positive and negative values doesn't trigger tooltip when touching negative values #978

Closed
valentinkatic opened this issue Apr 19, 2022 · 9 comments
Labels
Bar Chart bug Something isn't working

Comments

@valentinkatic
Copy link

I have stacked chart bar which can have both positive and negative values within BarChartRodStackItem and result chart looks like:
Screenshot_20220419_161134

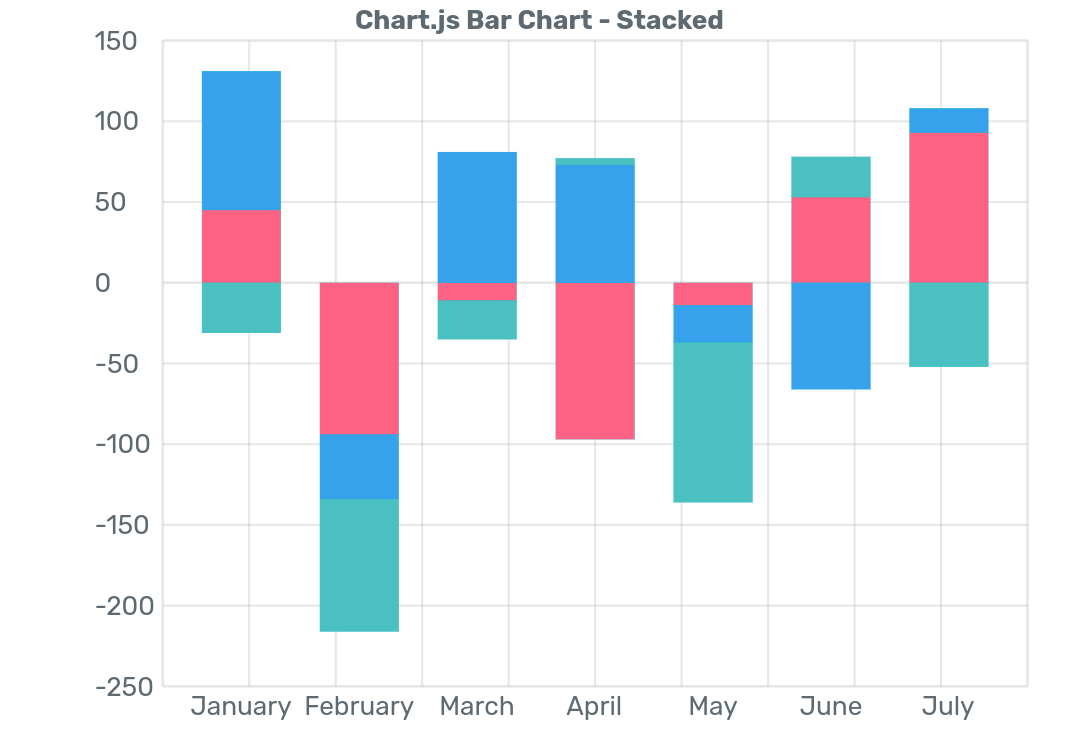
I also have tooltip which shows some detailed info:
Screenshot 2022-04-19 at 16 15 15

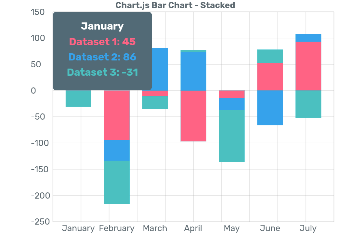
The issue I encounter is that clicking on positive values shows me tooltip, but not when I click on negative value.

With quick debugging I found out that problem lies in calculating bar Y values inside BarChartPainter class (which always calculates bar Y from 0) and replacing this piece of code (lines 520-529):

final isPositive = targetData.barGroups[i].barRods[j].toY > 0;
if (isPositive) {
  barTopY = getPixelY(
      targetData.barGroups[i].barRods[j].toY, viewSize, holder);
  barBotY = getPixelY(0, viewSize, holder);
} else {
  barTopY = getPixelY(0, viewSize, holder);
  barBotY = getPixelY(
      targetData.barGroups[i].barRods[j].toY, viewSize, holder);
}

with

final barRod = targetData.barGroups[i].barRods[j];
barTopY = getPixelY(barRod.toY, viewSize, holder);
barBotY = getPixelY(barRod.fromY, viewSize, holder);

resolves my issue but I'm not sure if this change affects anything else.

I'm using 0.50.1 version of library.

@imaNNeo
Copy link
Owner

imaNNeo commented Apr 20, 2022

Hi.
As I mentioned in the issue creation guide, you should provide me a reproducible code (a main.dart file).

@valentinkatic
Copy link
Author

Sorry for late response,
Here is reproducible code which should display same chart.
Since data I get from api and final data are not in the same form, first I need to convert it into the final form and calculate some stuff (minY, maxY, steps between, ...)

main.dart
import 'package:fl_chart_demo/chart_widget.dart';
import 'package:flutter/material.dart';

void main() {
  runApp(const MyApp());
}

class MyApp extends StatelessWidget {
  const MyApp({Key? key}) : super(key: key);

  @override
  Widget build(BuildContext context) {
    return MaterialApp(
      title: 'Flutter Demo',
      home: Scaffold(
        appBar: AppBar(
          title: const Text('Flutter Demo Home Page'),
        ),
        body: Container(
          constraints: const BoxConstraints(maxHeight: 300),
          padding: const EdgeInsets.all(8),
          child: const ChartWidget(),
        ),
      ),
    );
  }
}
chart_widget.dart
import 'package:collection/collection.dart';
import 'package:fl_chart/fl_chart.dart';
import 'package:flutter/material.dart';

Color primaryColor = const Color(0xFF5E6A71);
Color chartGridColor = Colors.grey.withOpacity(0.25);

TextStyle chartTextStyle = TextStyle(
  fontSize: 10,
  color: primaryColor,
);
TextStyle chartTitleStyle = chartTextStyle.copyWith(
  fontWeight: FontWeight.bold,
);
TextStyle chartTooltipStyle = const TextStyle(
  fontSize: 12,
  fontWeight: FontWeight.bold,
  color: Colors.white,
);

class ChartWidget extends StatefulWidget {
  const ChartWidget({Key? key}) : super(key: key);

  @override
  State<ChartWidget> createState() => _ChartWidgetState();
}

class _ChartWidgetState extends State<ChartWidget> {
  late Chart chart;
  double maxY = 0;
  double minY = 0;

  @override
  void initState() {
    final labels = [
      "January",
      "February",
      "March",
      "April",
      "May",
      "June",
      "July"
    ];
    final datasets = [
      ChartDataset(
        "Dataset 1",
        const Color(0xFFFF6385),
        [45, -94, -11, -97, -14, 53, 93],
      ),
      ChartDataset(
        "Dataset 2",
        const Color(0xFF36A3EB),
        [86, -40, 81, 73, -23, -66, 15],
      ),
      ChartDataset(
        "Dataset 3",
        const Color(0xFF4BC0C0),
        [-31, -82, -24, 4, -99, 25, -52],
      ),
    ];

    List<ChartGroup> groups = [];
    double minOffset = 0;
    double maxOffset = 0;

    labels.forEachIndexed((index, label) {
      var negativeOffset = 0;
      var positiveOffset = 0;
      List<ChartItem> items = datasets.map((dataset) {
        final value = dataset.data[index];
        if (value < 0) {
          negativeOffset += value;
          if (negativeOffset < minOffset) {
            minOffset = negativeOffset.toDouble();
          }
        } else {
          positiveOffset += value;
          if (positiveOffset > maxOffset) {
            maxOffset = positiveOffset.toDouble();
          }
        }
        return ChartItem(dataset.label, dataset.color, value);
      }).toList();
      groups.add(ChartGroup(index, label, items));
    });

    chart = Chart("Stacked Chart", groups);

    // generate steps for chart
    double offsetsDifference = maxOffset - minOffset;
    double step = offsetsDifference / 8;
    for (var s in [1, 2, 5, 10, 25, 50, 100]) {
      if (s >= step) {
        step = s.toDouble();
        break;
      }
    }

    // calculate min/max Y chart values from min/max offsets or next closest step
    // check if highest rod overflows highest step and add step
    var stackUnit = maxOffset ~/ step;
    maxY = (stackUnit * step == maxOffset) ? maxOffset : (stackUnit + 1) * step;
    // check if lowest rod overflows lowest step and add step
    stackUnit = minOffset ~/ step;
    minY = (stackUnit * step == minOffset) ? minOffset : (stackUnit - 1) * step;

    super.initState();
  }

  BarTooltipItem tooltipItem(ChartGroup chartGroup) {
    final title = chartGroup.label;

    return BarTooltipItem(
      title,
      chartTooltipStyle,
      children: chartGroup.items.map(
        (chartItem) {
          return TextSpan(
            text: "\n${chartItem.label}: ${chartItem.value}",
            style: chartTooltipStyle.copyWith(
              color: chartItem.color,
            ),
          );
        },
      ).toList(),
    );
  }

  BarChartGroupData groupData(ChartGroup chartGroup) {
    final positiveY = chartGroup.items
        .map((e) => e.value)
        .where((value) => value > 0)
        .sum
        .toDouble();
    final negativeY = chartGroup.items
        .map((e) => e.value)
        .where((value) => value < 0)
        .sum
        .toDouble();

    var positiveOffset = 0.0;
    var negativeOffset = 0.0;

    return BarChartGroupData(x: chartGroup.x, groupVertically: true, barRods: [
      BarChartRodData(
        fromY: negativeY,
        toY: positiveY,
        width: 30,
        borderRadius: const BorderRadius.all(Radius.zero),
        rodStackItems: chartGroup.items.map((item) {
          double fromY;
          double toY;

          if (item.value < 0) {
            fromY = negativeOffset;
            negativeOffset += item.value;
            toY = negativeOffset;
          } else {
            fromY = positiveOffset;
            positiveOffset += item.value;
            toY = positiveOffset;
          }

          return BarChartRodStackItem(fromY, toY, item.color);
        }).toList(),
      ),
    ]);
  }

  @override
  Widget build(BuildContext context) {
    return BarChart(
      BarChartData(
        maxY: maxY,
        minY: minY,
        alignment: BarChartAlignment.spaceEvenly,
        titlesData: FlTitlesData(
          bottomTitles: AxisTitles(
            sideTitles: SideTitles(
              showTitles: true,
              getTitlesWidget: (value, titleMeta) => Text(
                chart.chartGroups[value.toInt()].label,
                style: chartTextStyle,
              ),
            ),
          ),
          leftTitles: AxisTitles(
            sideTitles: SideTitles(
              showTitles: true,
              getTitlesWidget: (value, titleMeta) => Text(
                titleMeta.formattedValue,
                style: chartTextStyle,
              ),
              reservedSize: 26,
            ),
          ),
          topTitles: AxisTitles(
            sideTitles: SideTitles(),
            axisNameWidget: Text(
              chart.title,
              style: chartTitleStyle,
            ),
          ),
          rightTitles: AxisTitles(),
        ),
        gridData: FlGridData(
          getDrawingHorizontalLine: (value) => FlLine(
            color: chartGridColor,
            strokeWidth: value == 0 ? 1 : 0.8,
          ),
          drawVerticalLine: true,
          getDrawingVerticalLine: (value) => FlLine(
            color: chartGridColor,
            strokeWidth: 0.8,
          ),
        ),
        borderData: FlBorderData(border: Border.all(color: chartGridColor)),
        barTouchData: BarTouchData(
          touchTooltipData: BarTouchTooltipData(
            fitInsideVertically: true,
            fitInsideHorizontally: true,
            getTooltipItem: (group, groupIndex, rod, rodIndex) =>
                tooltipItem(chart.chartGroups[groupIndex]),
          ),
        ),
        barGroups: chart.chartGroups.map((group) => groupData(group)).toList(),
      ),
    );
  }
}

class Chart {
  String title;
  List<ChartGroup> chartGroups;

  Chart(this.title, this.chartGroups);
}

class ChartDataset {
  final String label;
  final Color color;
  final List<int> data;

  ChartDataset(this.label, this.color, this.data);
}

class ChartGroup {
  int x;
  String label;
  List<ChartItem> items;

  ChartGroup(this.x, this.label, this.items);
}

class ChartItem {
  final String label;
  final Color color;
  final int value;

  ChartItem(this.label, this.color, this.value);
}

Bar Chart Groups containing positive values have tooltip as normally, but groups with only negative data doesn't show tooltip.

@imaNNeo
Copy link
Owner

imaNNeo commented Jun 2, 2022

There is a dependency that I don't have to run your code:

Please simplify your code. I cannot add a dependency per issue to check the problem.

@valentinkatic
Copy link
Author

I didn't use any additional dependencies to make this demo. 'sum' is method from collection package which can be imported (import 'package:collection/collection.dart'; ) because fl_chart depends on equatable package and equatable depends on collection.

@imaNNeo
Copy link
Owner

imaNNeo commented Jun 2, 2022

Oh, you're right. Apologize.
I'm checking it now.

@imaNNeo
Copy link
Owner

imaNNeo commented Jun 2, 2022

I've just fixed this problem in the master branch.
Wait for the next version :)
If you're in hurry, you can use master build in your project.

@valentinkatic
Copy link
Author

Thank you! I was using older version of package which didn't had this problem but I'll wait next version to upgrade :)

@imaNNeo imaNNeo added bug Something isn't working and removed Needs Reproducible Code labels Jun 17, 2022
@imaNNeo
Copy link
Owner

imaNNeo commented Jun 17, 2022

It has just been fixed in the 0.55.0 version. Please check it out!

@imaNNeo imaNNeo closed this as completed Jun 17, 2022
@valentinkatic
Copy link
Author

I wasn't able to check it out earlier, but it's working perfectly now. Thank you!

Sign up for free to join this conversation on GitHub. Already have an account? Sign in to comment
Labels
Bar Chart bug Something isn't working
Projects
None yet
Development

No branches or pull requests

2 participants