x/net/http2: Stuck http requests #56385
Comments
|
Sorry, why is this marked "WaitingForInfo"? I don't see any requests for additional information. |
|
I'v also encountered a similar problem. go version is |

|
I use var DefaultTransport = &http.Transport{
Proxy: http.ProxyFromEnvironment,
DialContext: (&net.Dialer{
Timeout: 30 * time.Second,
KeepAlive: 30 * time.Second}).DialContext,
ForceAttemptHTTP2: true,
MaxIdleConns: 100,
IdleConnTimeout: 90 * time.Second,
TLSHandshakeTimeout: 10 * time.Second,
ExpectContinueTimeout: 1 * time.Second,
MaxConnsPerHost: 20,
MaxIdleConnsPerHost: 100,
}
var defaultClient *http.Client
func InitDefaultClient() {
err := http2.ConfigureTransport(DefaultTransport)
if err != nil {
// just for exception
logs.Info("config default http client transport err, %v", err)
defaultClient = http.DefaultClient
} else {
// in use
defaultClient = &http.Client{Transport: DefaultTransport}
}
}But there's still the same problem. |
|
I have seen the same problem as @Yuhjiang, but haven't been able to reproduce it either. Here are the stacks when it occurs: |
|
@mhr3 , you've said you're using The goroutine profile from the proxy server reports a total of 806 goroutines in the app, but the stack traces shown only cover 242+242+201+35+17+7+6+4+4+3 = 761 goroutines. What are the call stacks of the other 45 goroutines? There's probably a single goroutine that's holding a lock of interest, and there's probably only one goroutine with that particular call stack. @stampy88 , you're using the http2 support that comes bundled with net/http. What version of Go are you using? The line numbers make sense with Assuming that's the version in play, the goroutine profile shows that there are 1258 goroutines waiting on @Yuhjiang , thank you for including the version info. The screenshots are tricky, text is better. If you're starting with Looking again at the goroutines that have a unique call stack and considering if they are holding locks that many other goroutines are trying to obtain: It looks like this also is a call to |
|
yes, you are correct @rhysh, it is 1.18.6. When this occurs, we see a bunch of " context deadline exceeded (Client.Timeout exceeded while awaiting headers)" POSTing to the same URL (timeout is 5 seconds). There are 1,701 timeouts over the course of ~16 minutes, and no POSTs to that host succeed. It eventually clears up when the server on the other end starts responding. |
|
@rhysh the versions are in the stacktrace filenames: |
|
@stampy88 , I think that you and @Yuhjiang have a different bug than this issue describes. Could you please open a new issue for it? Issue #36026 may be similar, but doesn't include call stacks. Issue #32388 described a problem where an attempt to write to an http2-over-TLS connection could tie up an entire net/http.Transport while the Write call remained blocked. If I understand correctly, when there's a TCP connection that has outbound data in flight and which has received zero inbound packets (including ACKs), common configurations of Linux will time out the connection after about 15 or 16 minutes. The fix for 32388 (backported to go1.17.3 and go1.16.10) may have limited the impact of that to affect only a single connection, but the problem you're seeing might be a single-connection version. (Or a few simultaneous instances of a single-connection problem). Thanks @mhr3 .
I'm not sure how those two statements go together. Does it mean that some requests are served completely by the Go http/1.1 server (in If the difference you're describing is in the request body that the proxy machine sends to the backend, then maybe there's a difference in how/whether the content-length is passed (to the extent that's still relevant with http2). The stuck requests have The goroutine profile you shared shows a snapshot where four h2c connections were stalled in the same way, with a total of either 201+35+6 = 242 (proxy's view) or 243 (backend's view) requests in progress. Can you say any more about the dynamics?
If it's a flow-control problem, I think it'll be hard to solve without a reproducer. |
Yes, the content-length is probably the difference here. To make it clearer, we have two types of endpoint handlers (greatly simplified):
Fwiw the two snapshots weren't taken at the exact same millisecond, so do not expect the numbers to match up perfectly. The strange thing here is that the server gets into this stuck state after a few days or running fine (we used to see this happen about twice a week), yet if we restart the server every ~three days, it never gets into this broken state (we only restart the main server, not the backend server), perhaps it's related to cancellations (we do see small number of context cancellations coming from the client (it uses fairly small timeout)), but that's just a guess. FWIW here's a chart with number of active goroutines from last time this happened:
Some requests started failing around 11:20, and we restarted everything at 11:30. This also shows it's not like there was a gradual increase in number of stuck requests over the few days with some threshold being reached (or at least if there is, it doesn't consume goroutines).
We don't really have those numbers, but I think we usually use just one connection.
We restart the server after it gets into this state, so can't really say.
Yes, even when the server is stuck lots of requests still finish successfully.
Not 100% certain, but yes, I think all those are stuck. But as I said, there are still other requests that do get processed correctly (by the "stuck" server, not just the other instances). |

|
@rhysh thanks for you suggestion. Since last updating, I'v only seen the problem once which is the comment I posted two weeks ago. It's working properly over two weeks. |
|
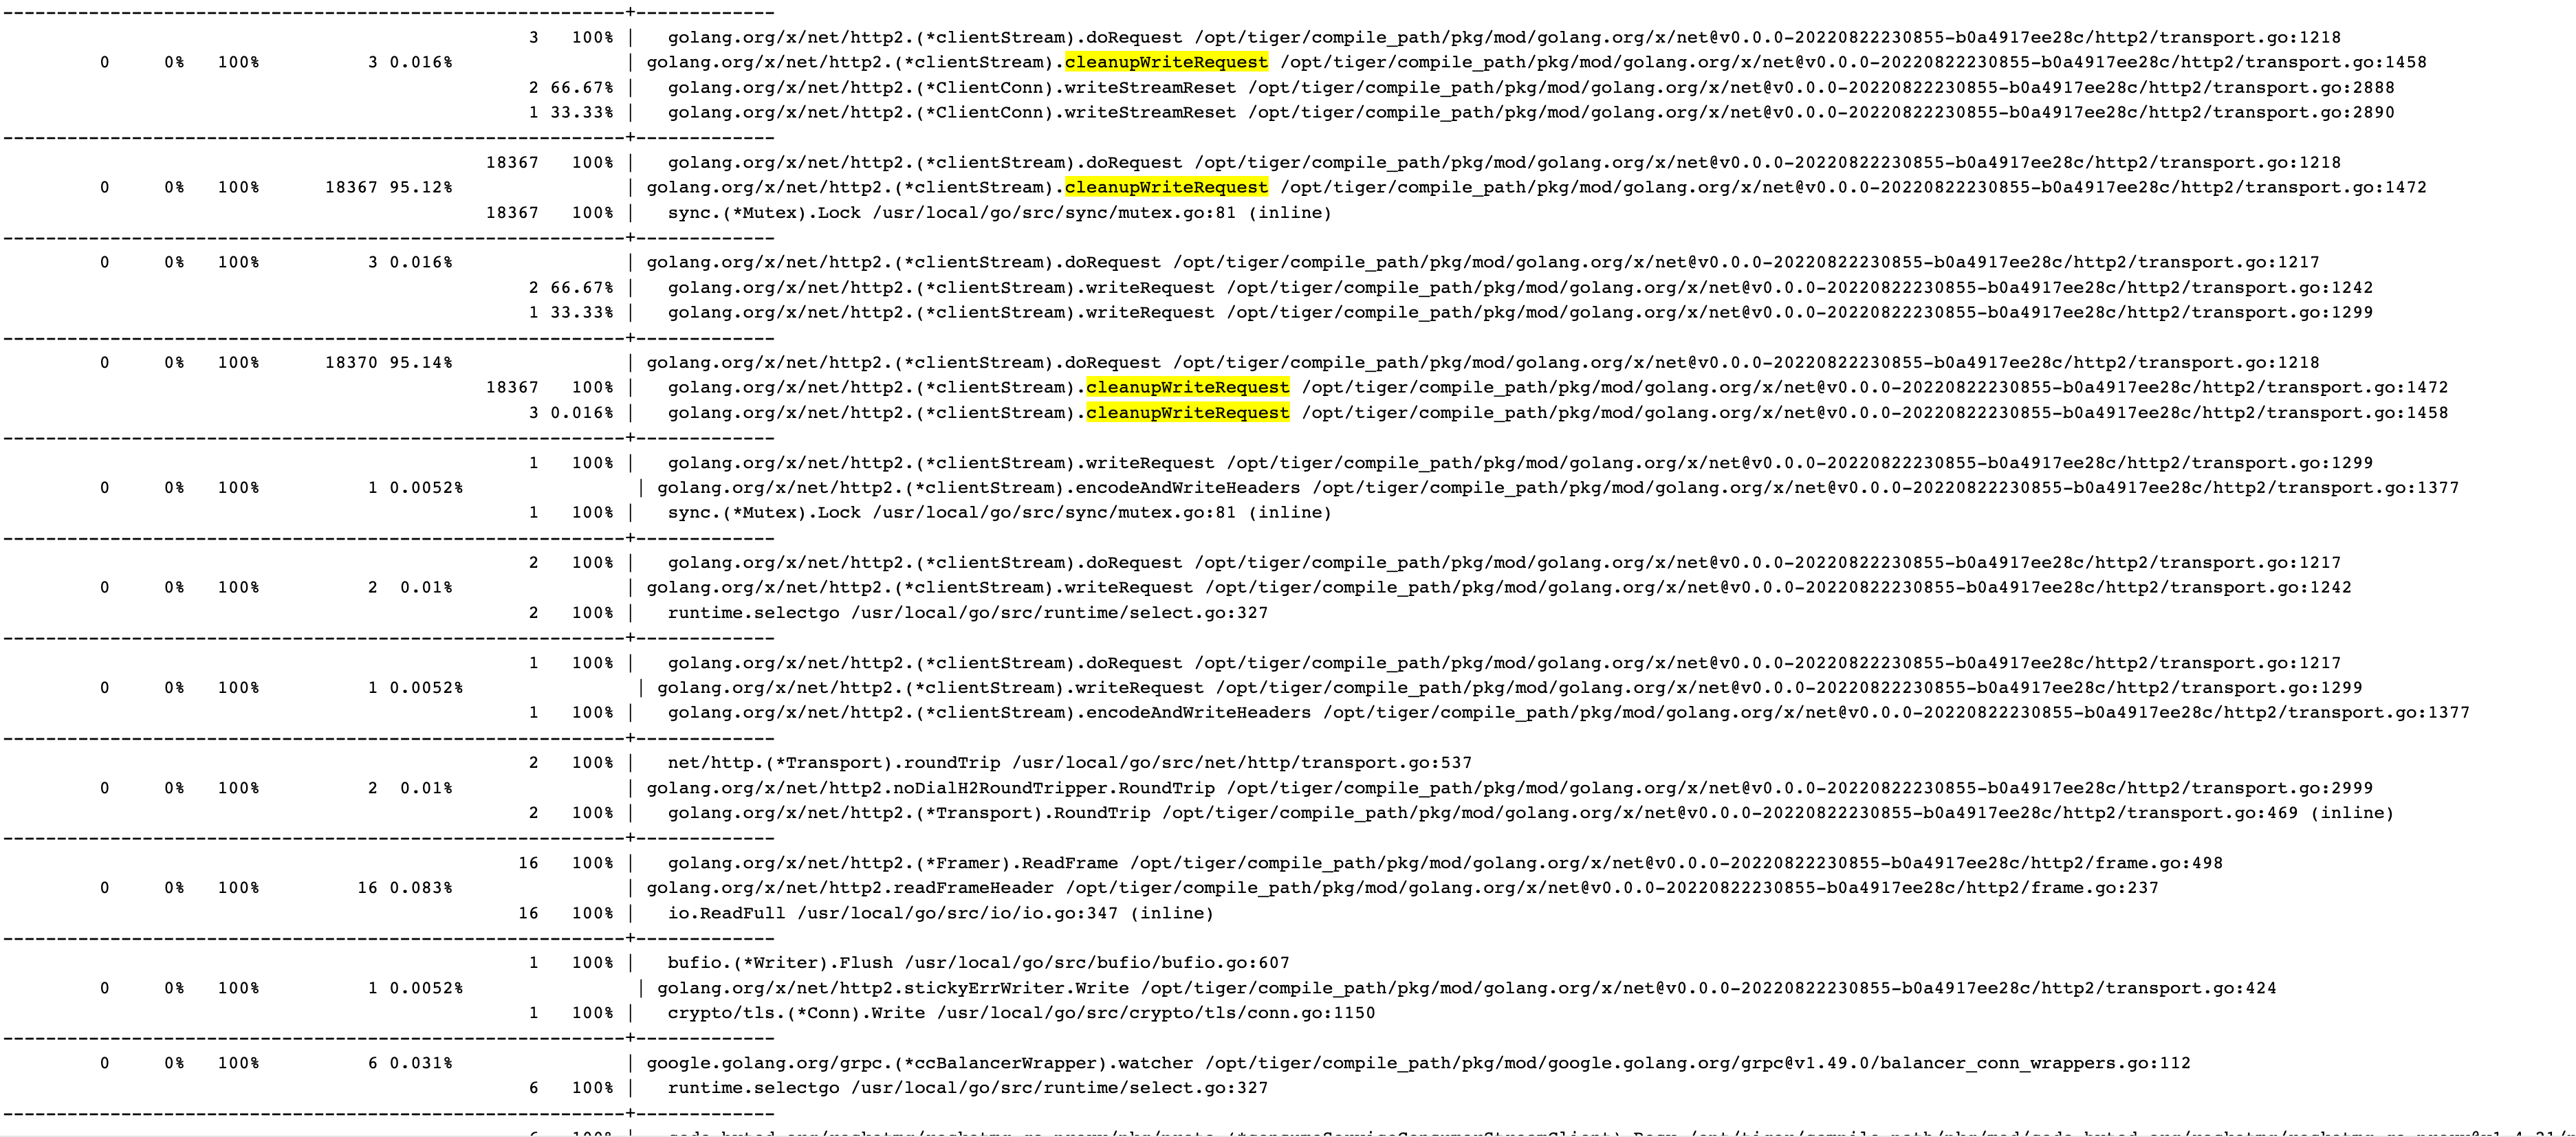
There is a snapshot of It seems also weird that the total goroutines is 36365 which didn't match with the sum of each stack's goroutines. |
|
I'm also checking because I got transaction lock while using http proxy. It took a while to receive the 9M file from the proxy and server as follows. http2 http1.1 Although http2 is said to be multiplexed, a single connection shows a limit on a single connection. |
|
Additionally, in my case, I was sending 100 http2 stream requests. |
What version of Go are you using (
go version)?Does this issue reproduce with the latest release?
Haven't tried
What did you do?
We're running a http server which uses a http client to proxy the request body to another server (using h2c) and return its response body, we've recently noticed there's sometimes a bunch of requests getting stuck waiting for a sync.Cond, unfortunately I do not have a reproducer (this works fine 99.9% of the time), but I do have goroutine stacktraces from both the servers. Hoping someone more familiar with the http code internals might offer some help, as from what I can tell from the stacktraces, the client is waiting for the server to do something and the server is waiting for the client (ie looks like a deadlock).
One thing to note is that only requests which are proxied directly (io.Copy from the server Request into the client Request) get stuck, other requests where the body is constructed in memory were never affected.
Here's stacktraces from the server doing the proxying (some lines containing private code trimmed):
And here's stacktraces from the h2c server:
The text was updated successfully, but these errors were encountered: