During the three months of the internship the goal was to solve different tasks ranging from classical data science methods, to newer ones, including sparse SVD, etc. To deal with larger, as well as smaller datasets, handle preprocessing of data and cross-validating, training and testing different models.
The task is to perform binary classification on the Titanic dataset, given passenger data that includes:
- Passenger's surname, title, name (full name of spouse) -
Name, - Passenger's sex -
Sex, - Passenger's class -
PClass, - Passenger's age -
Age.
And using this data to predict whether or not the passenger has surivived the sinking of the Titanic.
Original dataset was parsed, bad and missing data was fixed and estimated.
We extracted passenger titles from their full names, missing titles were
estimated based on their sex, age and passenger class to one of the four
categories 'Mr', 'Mrs', 'Master', 'Ms'.
Different names for the same title were categorized, e.g. 'Ms' = ('Ms', 'Miss', 'Mlle')
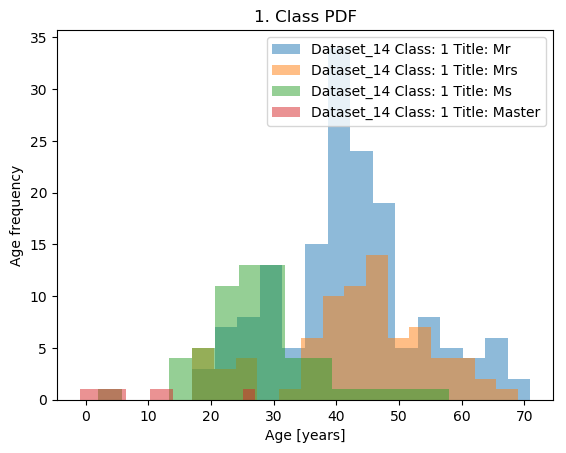
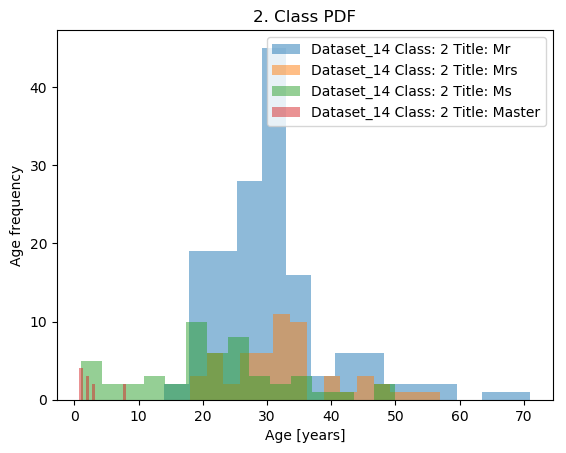
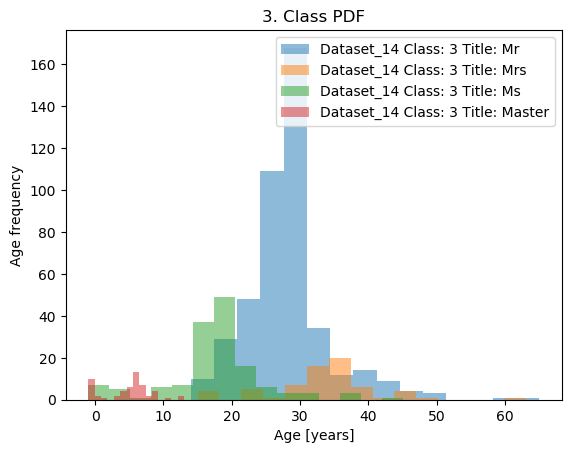
Age was estimated based on passenger class and title, different methods of age estimation were done, using mean and median age for different categories, as well as adding a small deviation from the mean/median age to preserve the age-class histograms.
We also added a new feature family_size which represents the number
of passengers with the same surname and the same passenger class onboard
the Titanic. With the idea being that families that travel always travel
together.
(This may not always hold, especially for the 3rd passenger
class, but the models have performed better with this naive
implementation)
This module performs basic dataset visualisations, listed below:
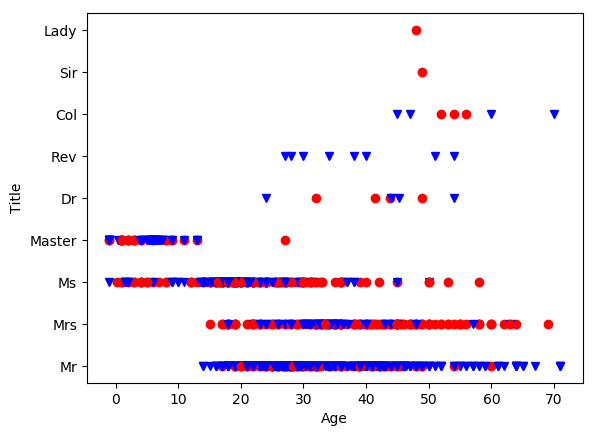
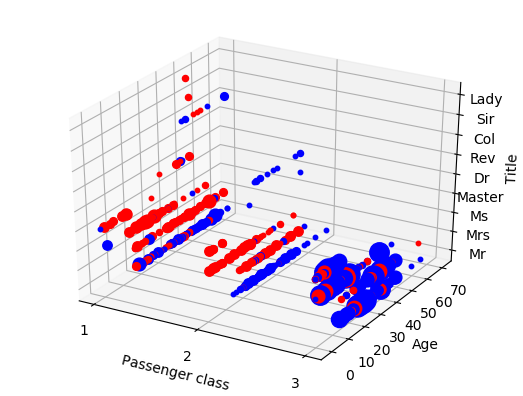
plot_age_histograms: createagehistograms for differentp_classandtitlecategories.plot_age_title: create 2D plots of those who have survived vs those less fortunate with x axis being their age and y axis passenger title.plot_age_title_class: create a 3D scatter graph of survivors, with an additional z axis ofp_classand the size of the point being determined by their familiy size.group_survivors_by_params: this creates multiindex pandas dataframes that group survivors by different list of attributes passed to the functioncreate_survivor_groups: a parent function that uses thegroup_survivors_by_paramsfunction to create groupings by different combinations of parameters.create_visualisations: a single function that performs the following:- create age histograms,
- create survivor groups dataframes,
- 2D plot of survivors by age and title,
- 3D plot of survivors by age, title, class and family_size.
Files generated by this function will appear in the /Data/Images,
/Data/Pickles, /Data/Dataframes folders.
After using this module, we get the following results (red represents survivors):
This module performs cross validation on four different classifiers, finding the following best hyper parameters:
- Dataset parameters:
mean: bool, represents whether we estimate age based on median or the mean age,std_dev_scale: float, represents the value of the standard deviation scaler used for age estimation. range: (0, 1)better_title: bool, represents whether we estimate age naively, based only on passenger sex or taking into consideration passenger title as well.
- Data format parameters:
scale_data: bool, do we need to scale the data or not,delete_fam_size: do we take into consideration the induced family size parametergroup_by_age: do we convert the continousageparameter to a categorical variable.
- Model parameters, these vary for different models.
The classifiers that we use are listed below:
- Decision tree,
- Gaussian Naive Bayes,
- Support Vector Machine,
- Logistic Regression.
And finally we use a Voting Classifier, that ensembles the previously trained classifiers, using their achieved validation accuracies as weights.
| Model name | Model params | Data format params | Dataset params | ||||
|---|---|---|---|---|---|---|---|
| Scale data | Delete fam_size | Group by age | Mean | std_dev scaler | Better title est. | ||
| Decision tree | max_depth: 4 | False | False | False | True | 0.6 | False |
| Gaussian Naive Bayes | None | False | False | True | True | 0.8 | False |
| Support Vector Machine | C: 1, gamma:0.03 | True | False | False | False | 0.2 | True |
| Logistic Regression | C: 1 | False | False | False | False | 0.4 | False |
| Voting Classifier | None | True | False | True | True | 0.2 | False |
| Decision Tree | ||
|---|---|---|
| Label | Estimated label | Probability |
| 0 | 0 | 0.90740741 |
| 0 |
0 | 0.90740741 |
| 1 | 1 | 0.91570881 |
| 0 | 0 | 0.90740741 |
| 0 | 0 | 0.89775561 |
| 0 | 0 | 0.89775561 |
| 1 | 0 | 0.67647059 |
| 1 | 1 | 0.91570881 |
| 1 | 1 | 0.91570881 |
| 1 | 0 | 0.67647059 |
| Gaussian Naive Bayes | ||
|---|---|---|
| Label | Estimated label | Probability |
| 0 | 0 | 0.999999390 |
| 0 |
0 | 0.999999390 |
| 1 | 0 | 0.569434327 |
| 0 | 0 | 0.841778072 |
| 0 | 0 | 0.835817807 |
| 0 | 0 | 0.835817807 |
| 1 | 1 | 0.612528817 |
| 1 | 1 | 0.883369126 |
| 1 | 1 | 0.831691072 |
| 1 | 0 | 0.521778528 |
| Support Vector Machine | ||
|---|---|---|
| Label | Estimated label | Probability |
| 0 | 0 | 0.92314078 |
| 0 |
0 | 0.92694052 |
| 1 | 1 | 0.65021272 |
| 0 | 0 | 0.81390982 |
| 0 | 0 | 0.86003766 |
| 0 | 0 | 0.8605255 |
| 1 | 0 | 0.83425303 |
| 1 | 1 | 0.97584139 |
| 1 | 1 | 0.82403036 |
| 1 | 0 | 0.80041372 |
| Logistic Regression | ||
|---|---|---|
| Label | Estimated label | Probability |
| 0 | 0 | 0.79770699 |
| 0 |
0 | 0.78271488 |
| 1 | 0 | 0.56420469 |
| 0 | 0 | 0.56946768 |
| 0 | 0 | 0.86886883 |
| 0 | 0 | 0.8673849 |
| 1 | 0 | 0.5175392 |
| 1 | 1 | 0.66775676 |
| 1 | 1 | 0.55726023 |
| 1 | 0 | 0.52991957 |
| Voting Classifier | ||
|---|---|---|
| Label | Estimated label | Probability |
| 0 | 0 | 0.91029576 |
| 0 |
0 | 0.91029576 |
| 1 | 1 | 0.59435627 |
| 0 | 0 | 0.69313934 |
| 0 | 0 | 0.86604043 |
| 0 | 0 | 0.86604043 |
| 1 | 0 | 0.59705601 |
| 1 | 1 | 0.89258578 |
| 1 | 1 | 0.81703188 |
| 1 | 0 | 0.7196419 |
numpy
pandas
scikit-learn
matplotlib
To install the package, download it from GitHub, and navigate to the Task2 folder and install using setup.py command:
$ python setup.py install
To use the installed package, you can either import it into your module with:
from ds_internship_task2 import create_new_datasets
from ds_internship_task2 import visualise_dataset
from ds_internship_task2 import titanic_classification
Or use the command line script as follows:
$ run-all /full/path/to/the/data/folder -cdata -cvis -tmodels -print -splt
This will create different datasets (-cdata), create visualisations (-cvis), train the models (-tmodels), print the results and current statuses (-print), as well as show plots that are created by the -cvis argument.
Of course, any of these arguments may be omitted but be careful not to
exclude the -tmodels arg if there are no pretrained models available in
the /Data/Pickles folder.
Amar Civgin
This project is licensed under the MIT License - see the LICENSE.md file for details
- Hat tip to anyone whose code was used
- Inspiration
- etc
