This project uses the dataset called 120 years of Olympic history from Kaggle. Methods like Data Cleaning and Data Preparation were used to get the data ready for analyzing.
The Dataset used here is called 120 years of Olympic history .It contains historical dataset on the modern Olympic Games, including all the Games from Athens 1896 to Rio 2016.
- Source: Kaggle
- Location: https://www.kaggle.com/heesoo37/120-years-of-olympic-history-athletes-and-results
- Content
The file athlete_events.csv contains 271116 rows and 15 columns; Each row corresponds to an individual athlete competing in an individual Olympic event (athlete-events).
The columns are the following:
ID- Unique number for each athlete;Name- Athlete's name;Sex- M or F;Age- Integer;Height- In centimeters;Weight- In kilograms;Team- Team name;NOC- National Olympic Committee 3-letter code;Games- Year and season;Year- Integer;Season- Summer or Winter;City- Host city;Sport- Sport;Event- Event;Medal- Gold, Silver, Bronze, or NA.
- In this step, we used data visualization and statistical techniques to describe dataset characterizations, such as size, quantity, and accuracy, in order to better understand the nature of the data.
- By initial analysis, we found that
Age, Height, Weight and Medalshad lot of missing values. - The column
Medalhad 231333 missing values. This is fine because not all the participants can win a medal. So replaced these values withnon. - To get the region of the Team in the athlete events.csv, there was merge done for athlete events and region dataset based on their NOC values.
- Problems – Some NOC present in the athlete events dataset does not associate to a country from the regions dataset. But we can easily add them manually based on their city Name. This was performed to reduce the number of missing values in the dataset.
- the columns
Age, Height and Weightcontain outliers values - we have found a strong relationship between the height and the weight so we have decided to handle them via Local Outlier Factor (LOF)
- however for the age, values range from
[10 to 97]as shown in the boxplot figure of the outlier in the visualtization before cleaning section. So, because all of these values are real, we can't get rid of any of them, so we've decided to keep all age outliers.
- we have used Barcharts, Boxplots, Distribution, Piecharts, and Scatterplots/Regplots to demonstrate the relationship between columns.
Here we will mention the datasets we merged to our dataset
- noc_regions -Location: [https://www.kaggle.com/heesoo37/120-years-of-olympic-history-athletes-and-results?select=noc_regions.csv];
NOC(National Olympic Committee 3 letter code);Country name(matches with regions in map_data("world"));Notes;- Country Wise GDP Data
- Source: Kaggle;
- Location: [https://www.kaggle.com/chadalee/country-wise-gdp-data];
Country Name;Country Code;Yearsa column for each year represents the GDP value of the country in this year;- Country Wise Population Data
- Source: Kaggle;
- Location: [https://www.kaggle.com/chadalee/country-wise-population-data];
Country Name;Country Code;Yearsa column for each year represents the population of the country in this year;
Host_Countryrepresent the hosting country for this rowGDP/Capitais a GDP per capita that generally indicates how rich each person in this country isMedal_Wontrue if a medal is won in this eventTeam_Eventtrue if this event is a team eventSingle_Eventtrue if this event is a single player event
The motivation of this anylsis is to find out the answers to the following questions:
- Who are the greatest olympics playing nations of all time ?
- What sports are the top countries best at?
- Does the size of the contingent relate with the number of medals ?
- Do hosting the olympics is an advatage to the hosting team ?
- Do richer countries perform better at olympics ?
- Can we predict the medal tally of a country ?
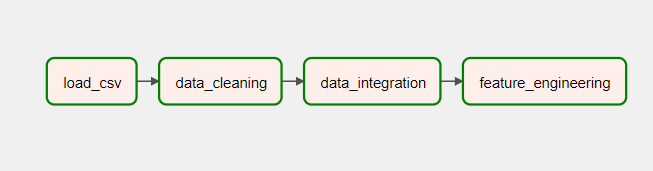
In this section a simplified ETL pipline was implemented to can and perform preprocessing steps.
This pipeline includes the following tasks:
- Load datasets from CSV files
- Cleaning the Data
- Data Integration
- Feature Engineering
A csv file for the dataframe is saved at the end of each pipeline.
The following graph shows the dependencies in the pipeline:
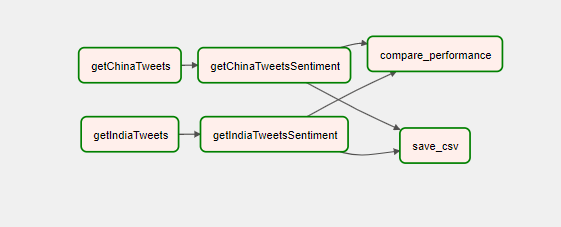
In this section, we selected China as one of the top performing countries in the Tokyo 2021 Olympics. and India as one of the poor performing countries.
We implemented a pipeline to run daily for a month to perform the following steps:
- Get 20 tweets for each country
- Perform sentiment analysis on the tweets using for example Python’s Textblob library.
- Average the sentiments of the tweets you retrieved so far for both countries
- Compare the results with the performance of the country in the Olympics.
- Results are saved in a csv file.
Except for the last task, the return value of each task is passed to the next task via XCOM.