Heng Log
On Fridays, please devote at least a half hour to reflect on the work you've done over the previous week. Please use this format:
Date Log of what you've done during the week (can be a bulleted list or as detailed as you want).
- Went over the initial given ReproZip Data and got the idea of how to map data with visualization
- Drafted and documented the ideas & use cases of how the visualizations and interactions can be for our application.
- Came up a consolidated list of questions and reviewed them with Remi
- Researched on visualization inspirations: datasketch , Andy Shora
- Picked the initial candidates of visualizations to work on for Tuesday.
- Tree Structure Examples: Dendrogram + Grouped Horizontal Bar Chart , Architecture Tree
- Arc Diagram Examples: D3 Arc Diagram , Similar Diversity
- Tried out the online D3 examples of Tree, Network and Arc Diagrams. Realized, the existing common diagram structure can not fully represent what we need to present from ReproZip trace.
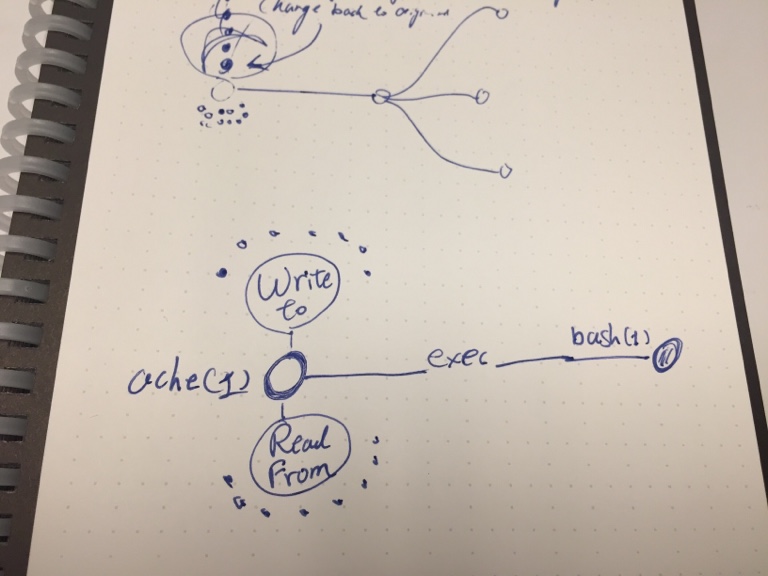
- Taking the consideration of Remi's suggestion on the timeline design for performance comparison for future development. Since this approach does add value for visualizing the provenance graph, I started to draft a markup that is suitable for ReproZip trace
- Drafted the following markups by recreated the bash-count and digits-io diagram with the new design:
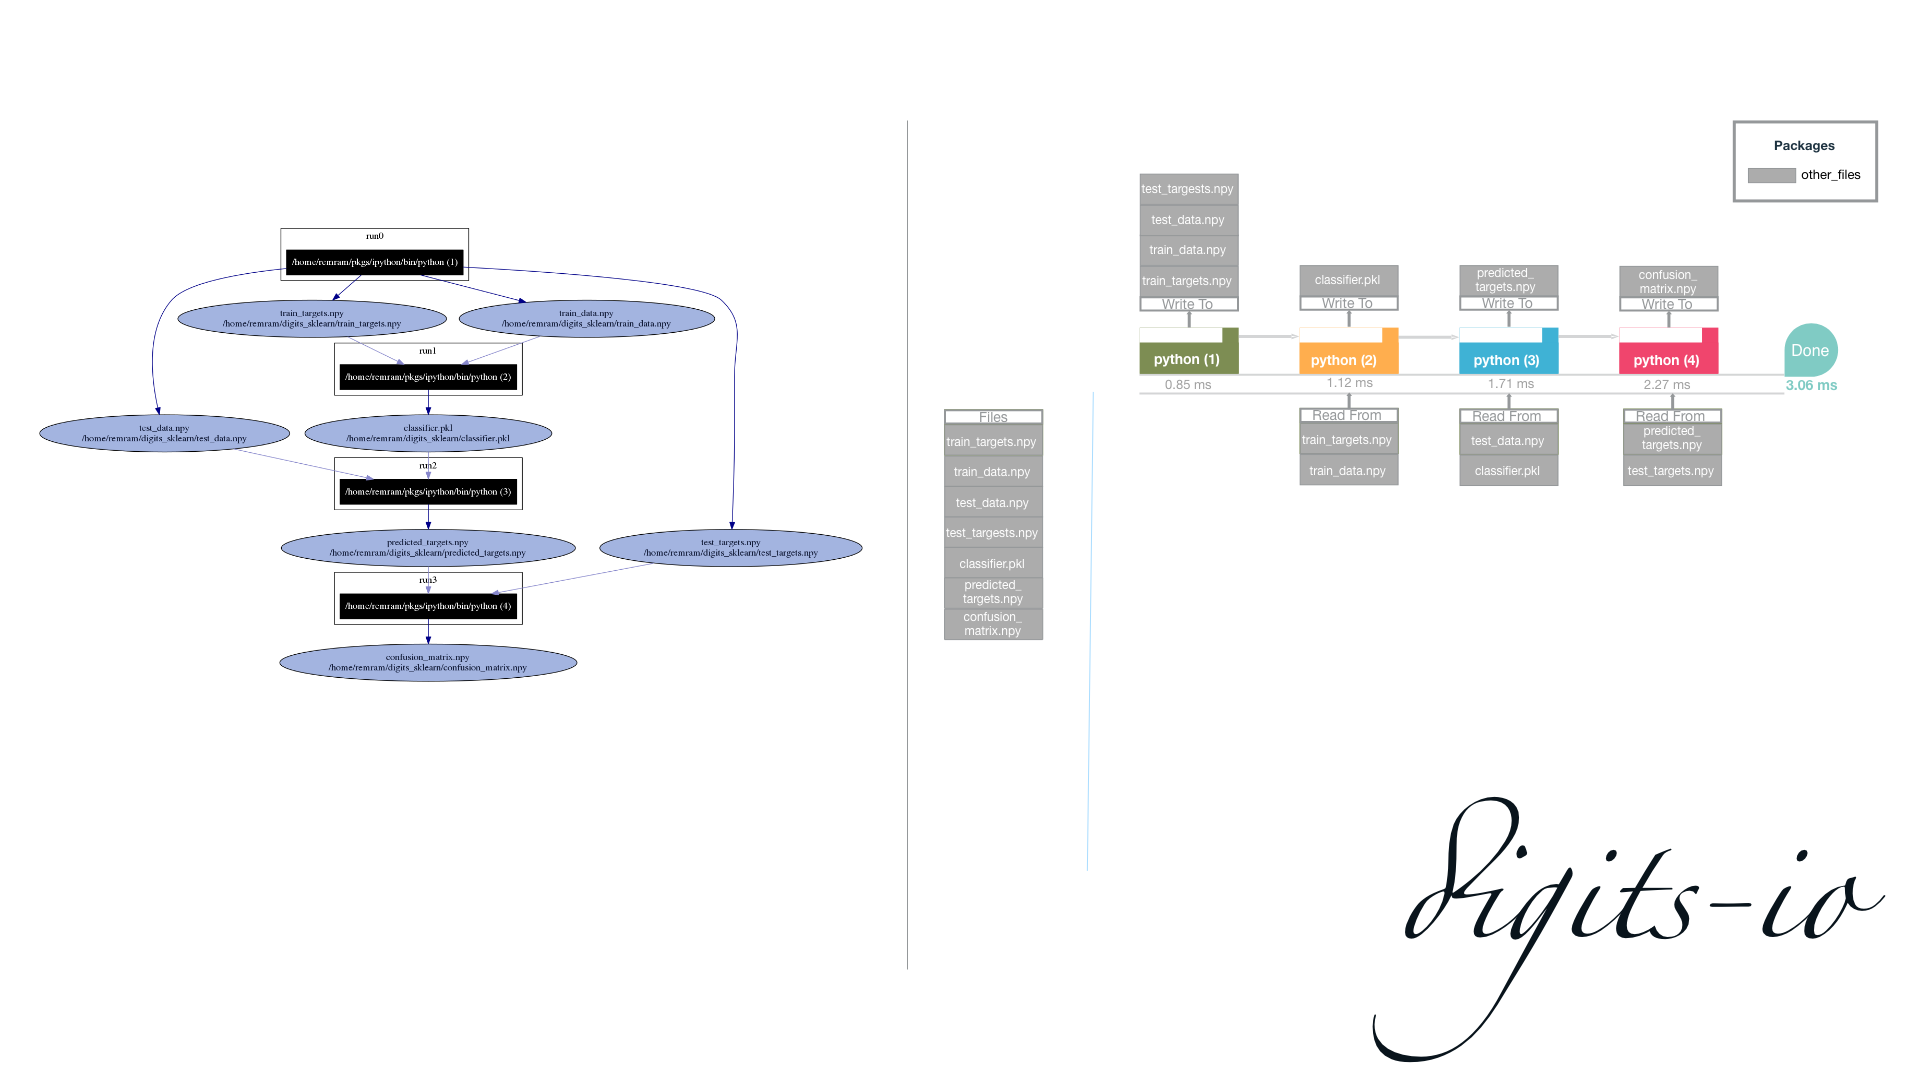
Digits-io comparison with the previous design.
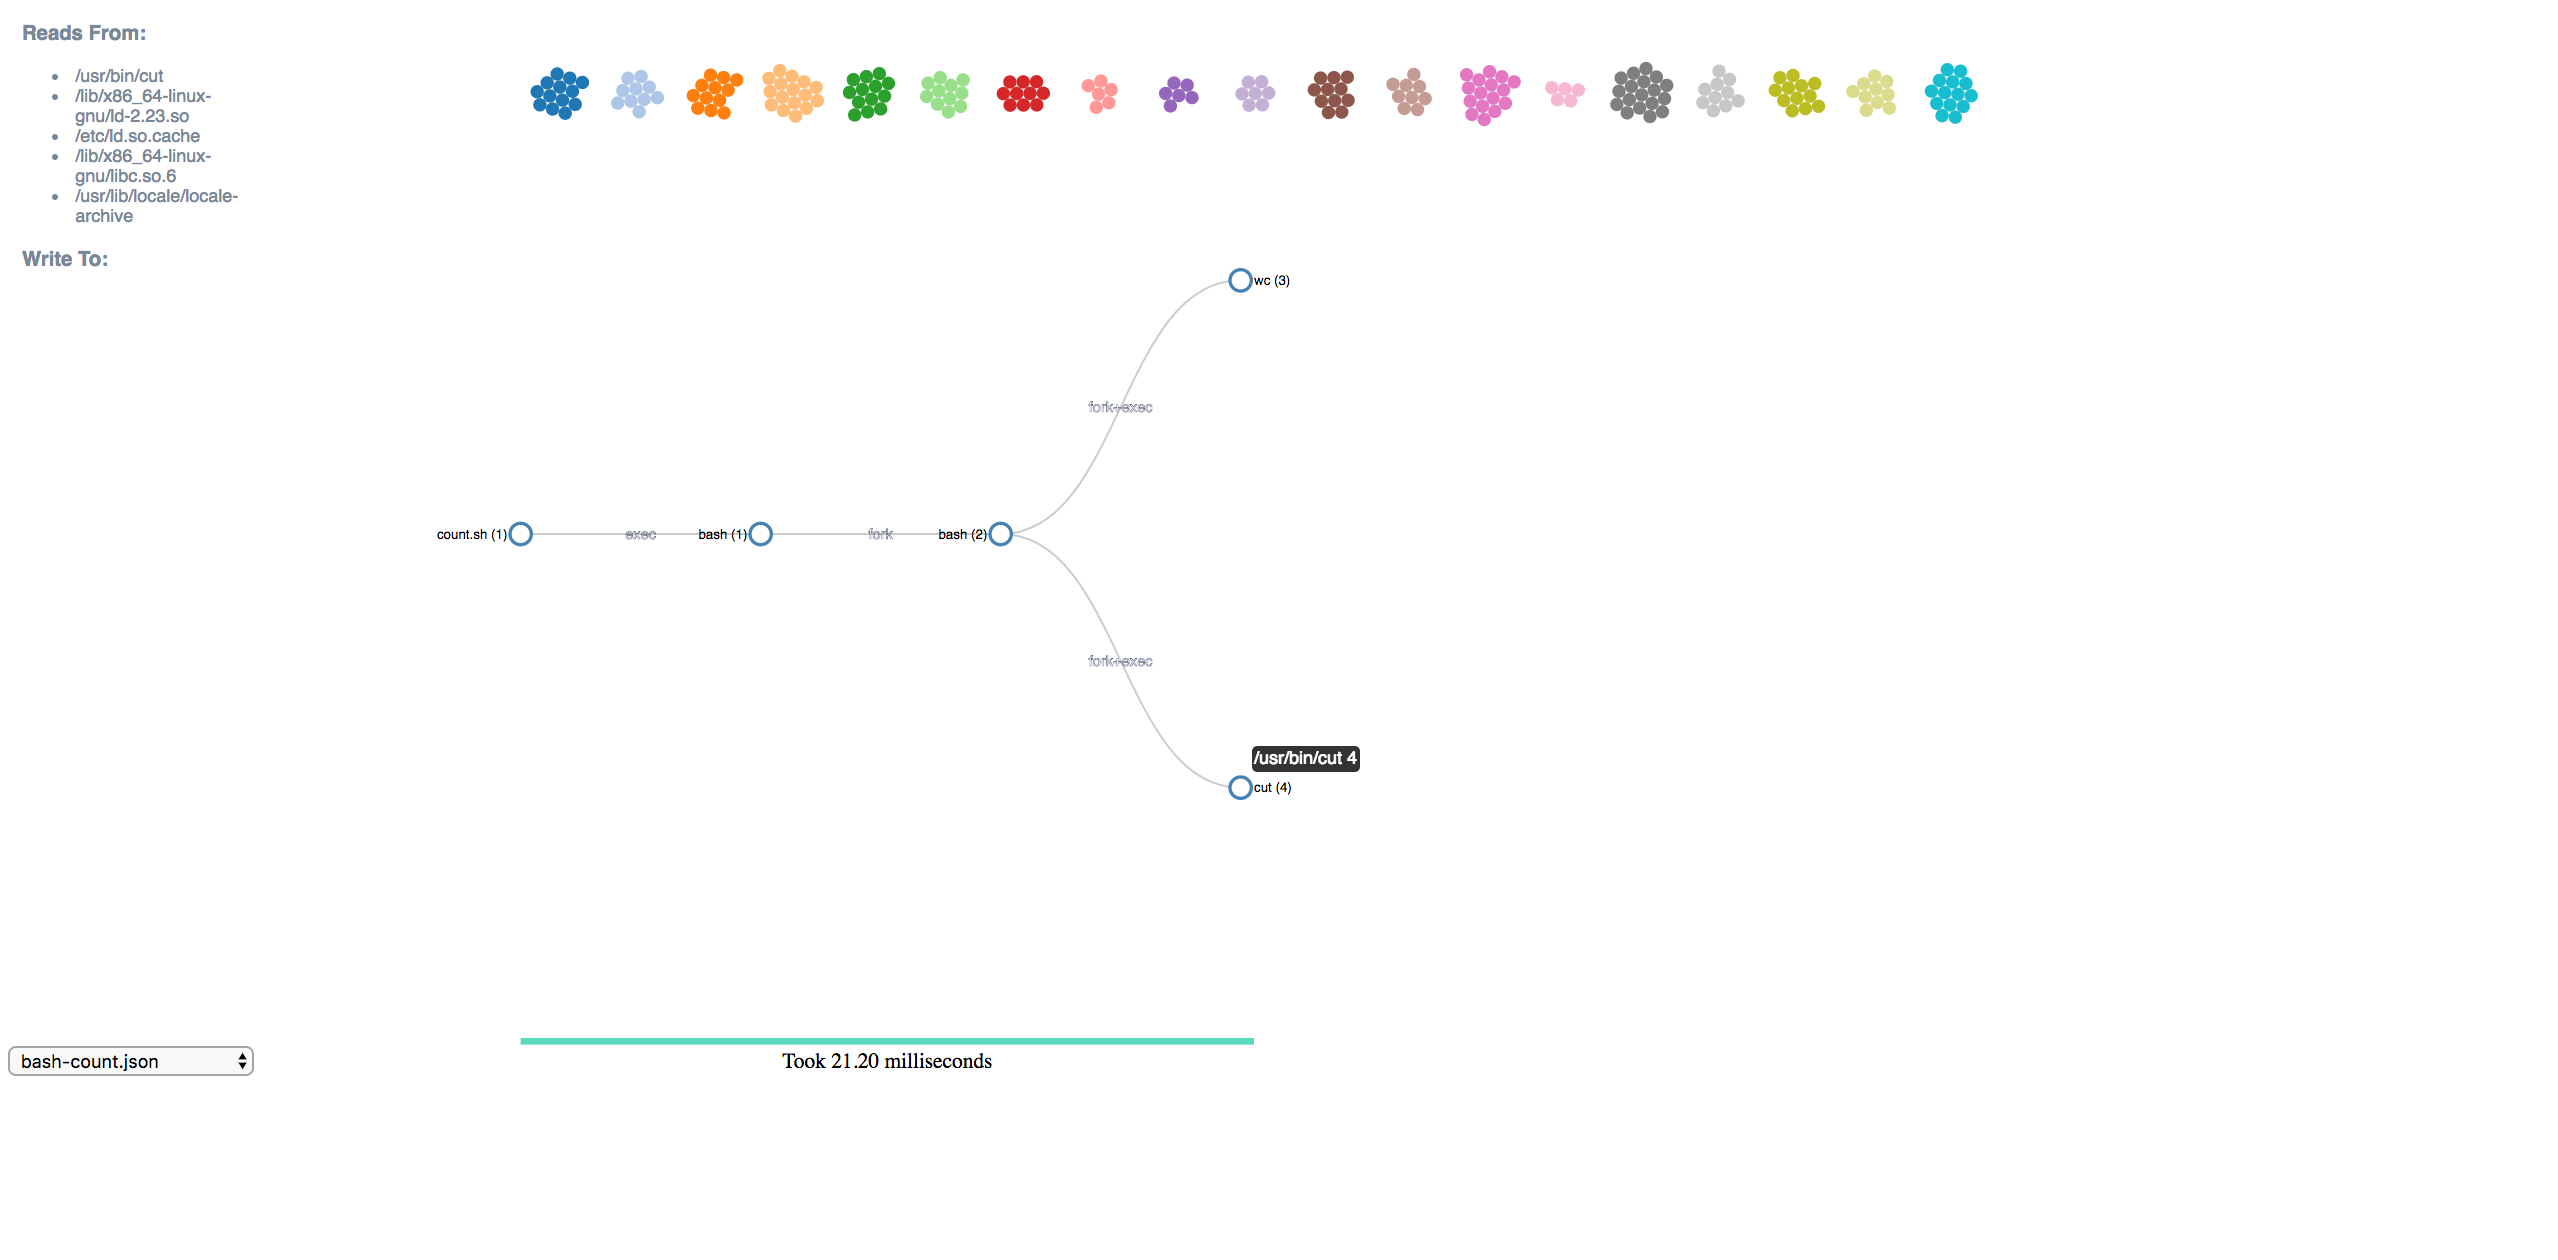
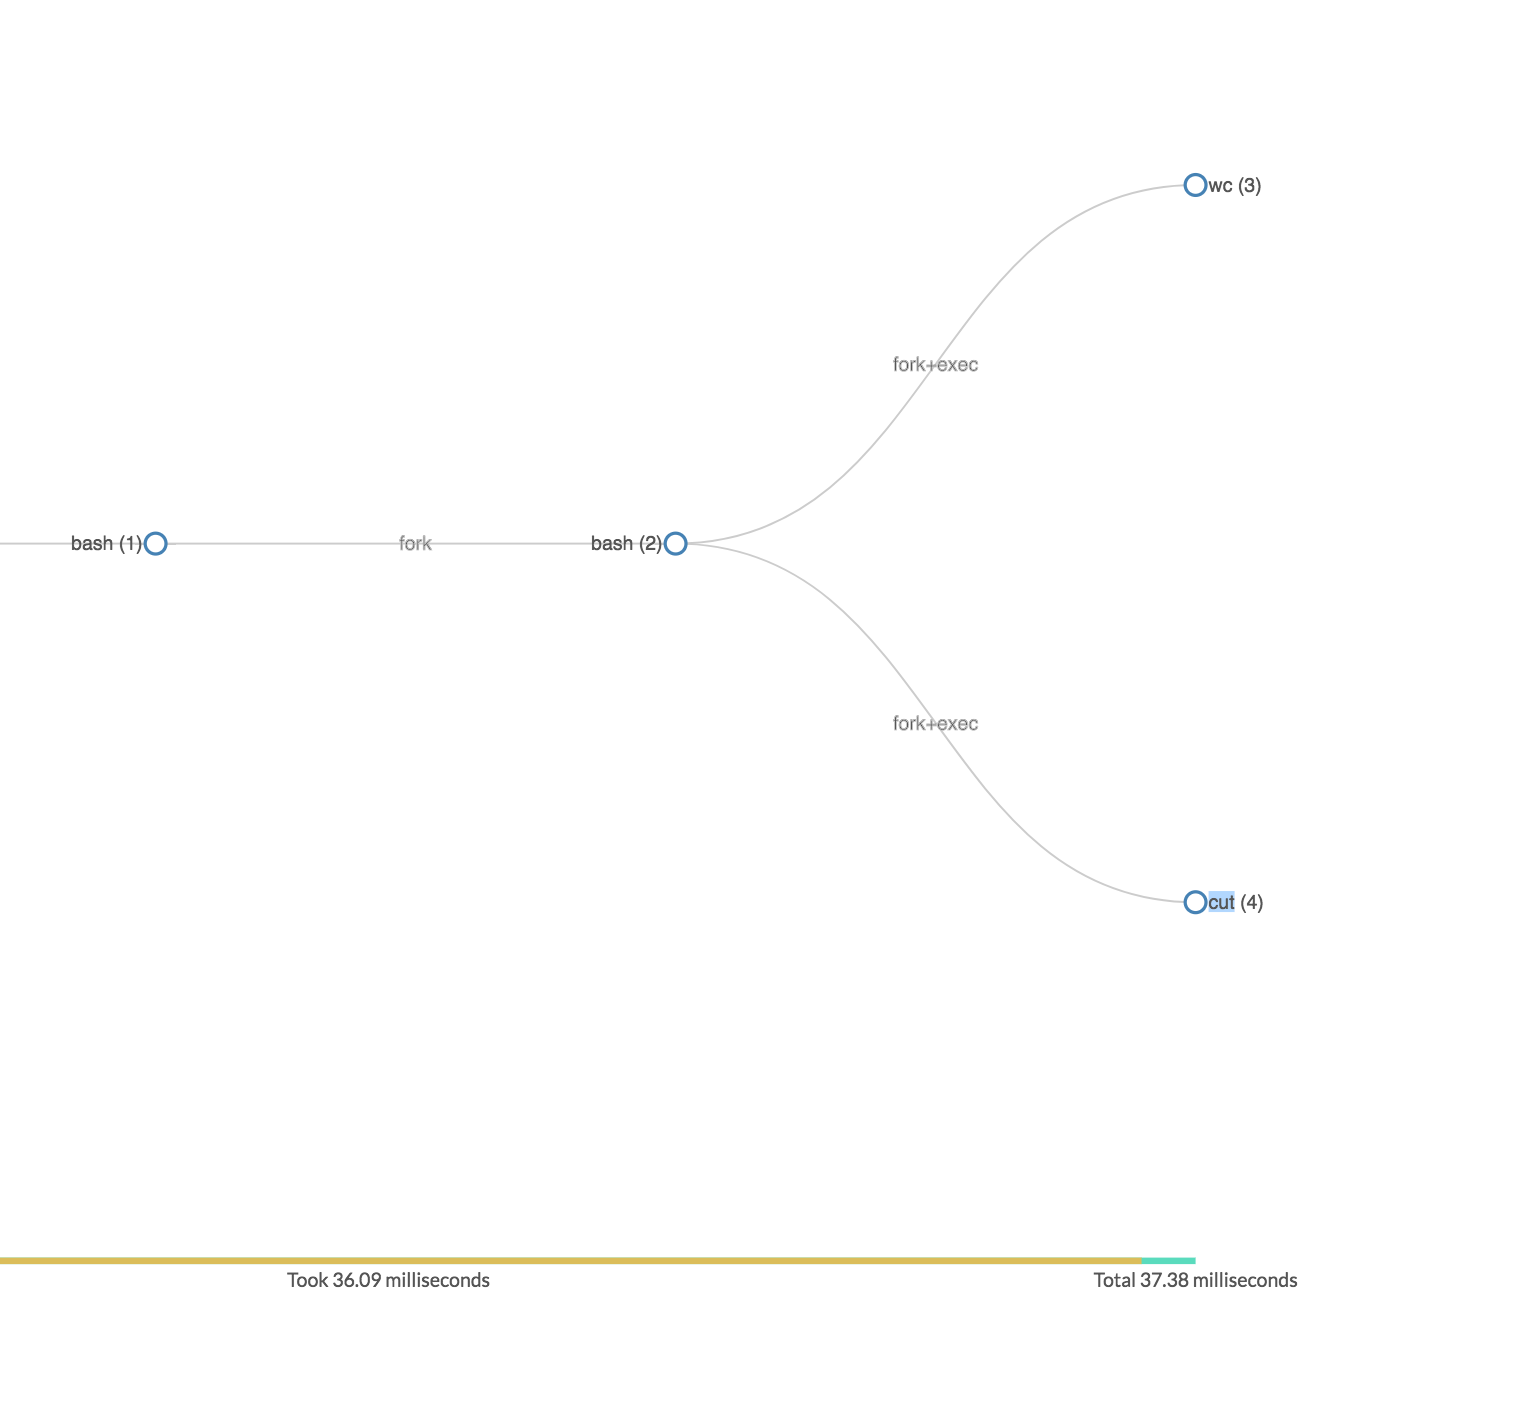
Bash-count comparison with the previous design.
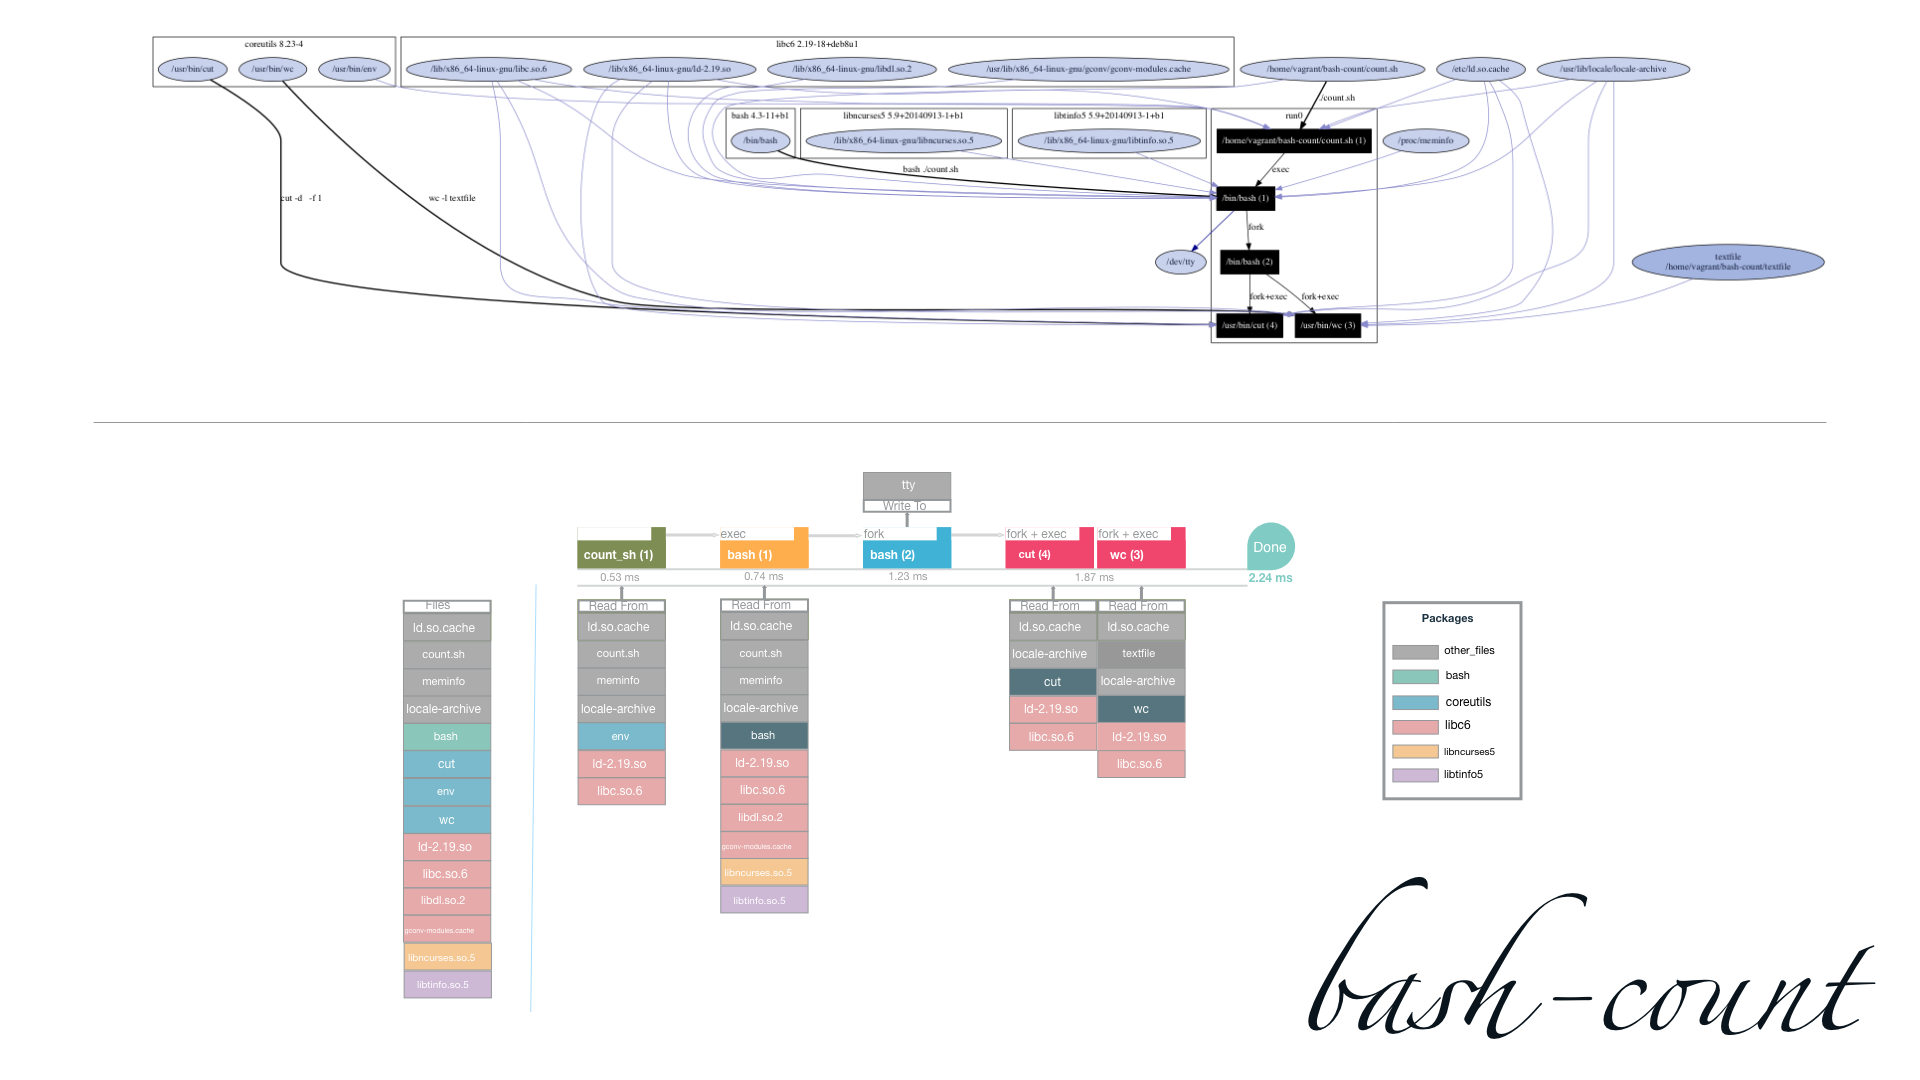 Bash-count comparison with the previous design.
- Reviewed and compared the new JSON file and old JSON files that Remi sent me.
- Composted a list of questions and suggestions to go over with Remi on Tuesday.
- Inprogress, enhancing the existing design to reflect the new JSON file format.
- The goal for next week: Finalized the design and start coding for the first iteration.
- Reviewed and updated the visual markups. Created multiple markups to figure out what can be done and what should not.
- Discovered few bugs from reprounzip(ex. Python regression that prevent reprounzip graph to generate the provenance graph in Python 3.6).
- Reproduced and generated the provenance graph for multiple experiments from the Reprozip Examples Page to get the better understanding of different varieties of provenance graph.
- Reviewed D3 tree diagram data structure and coded the functions to map the data from the json files to the D3 specified data structure.
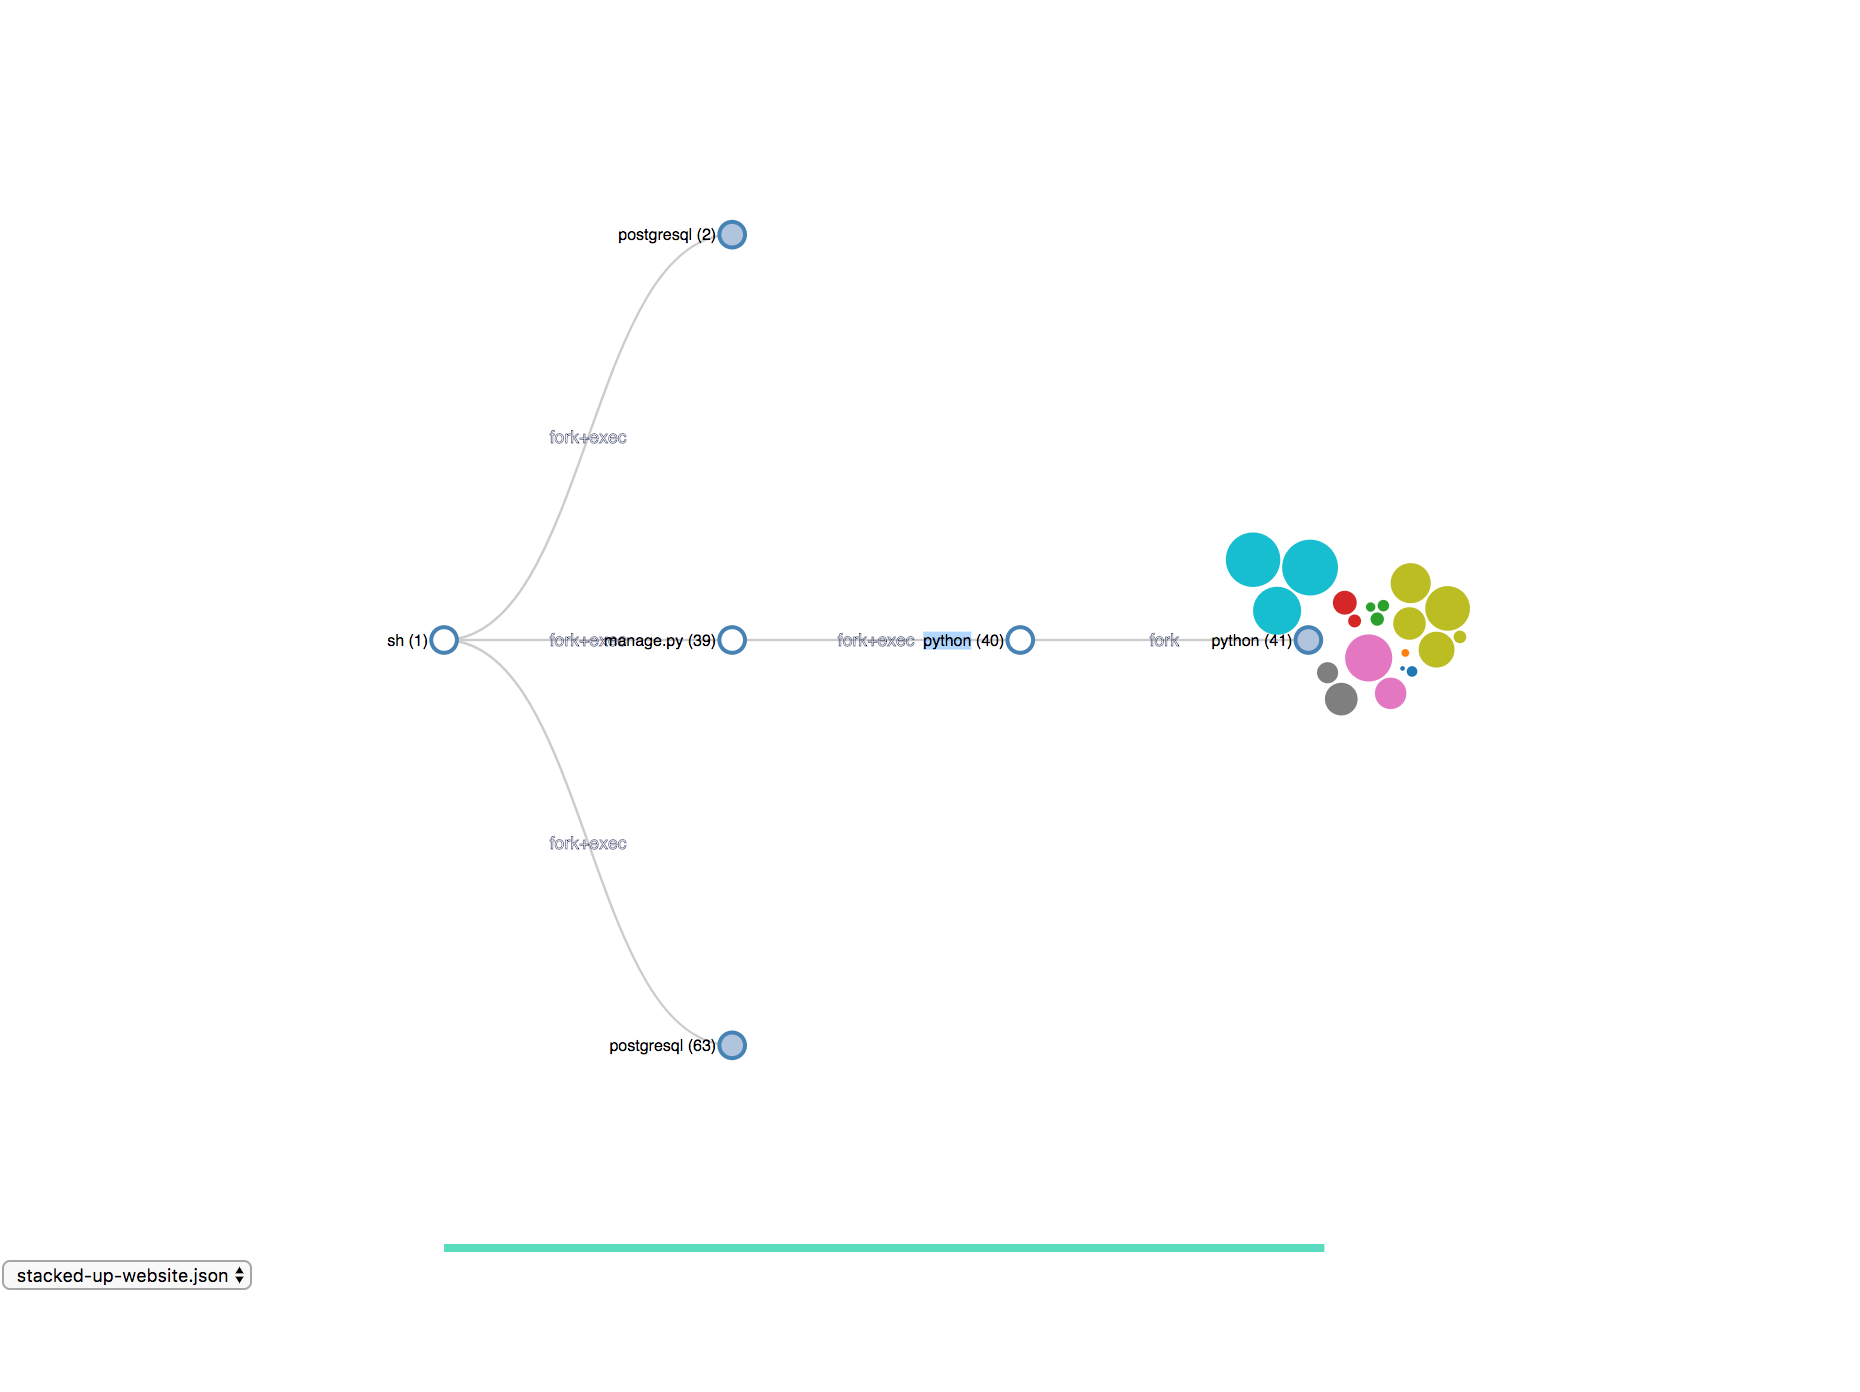
- Started coding on a working prototype:
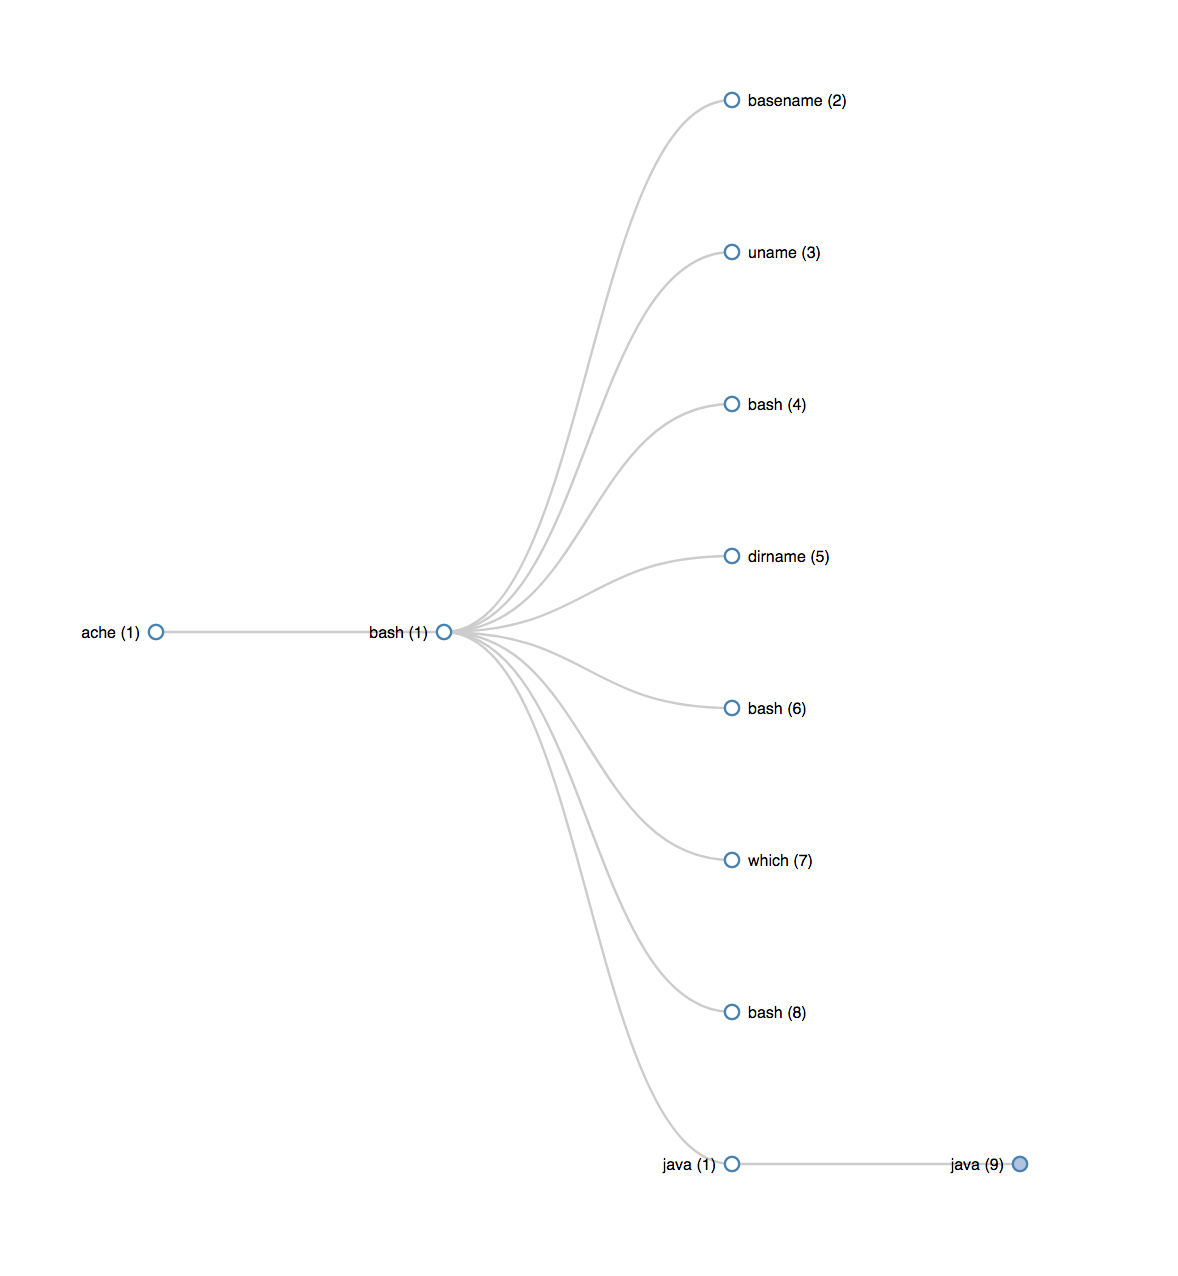
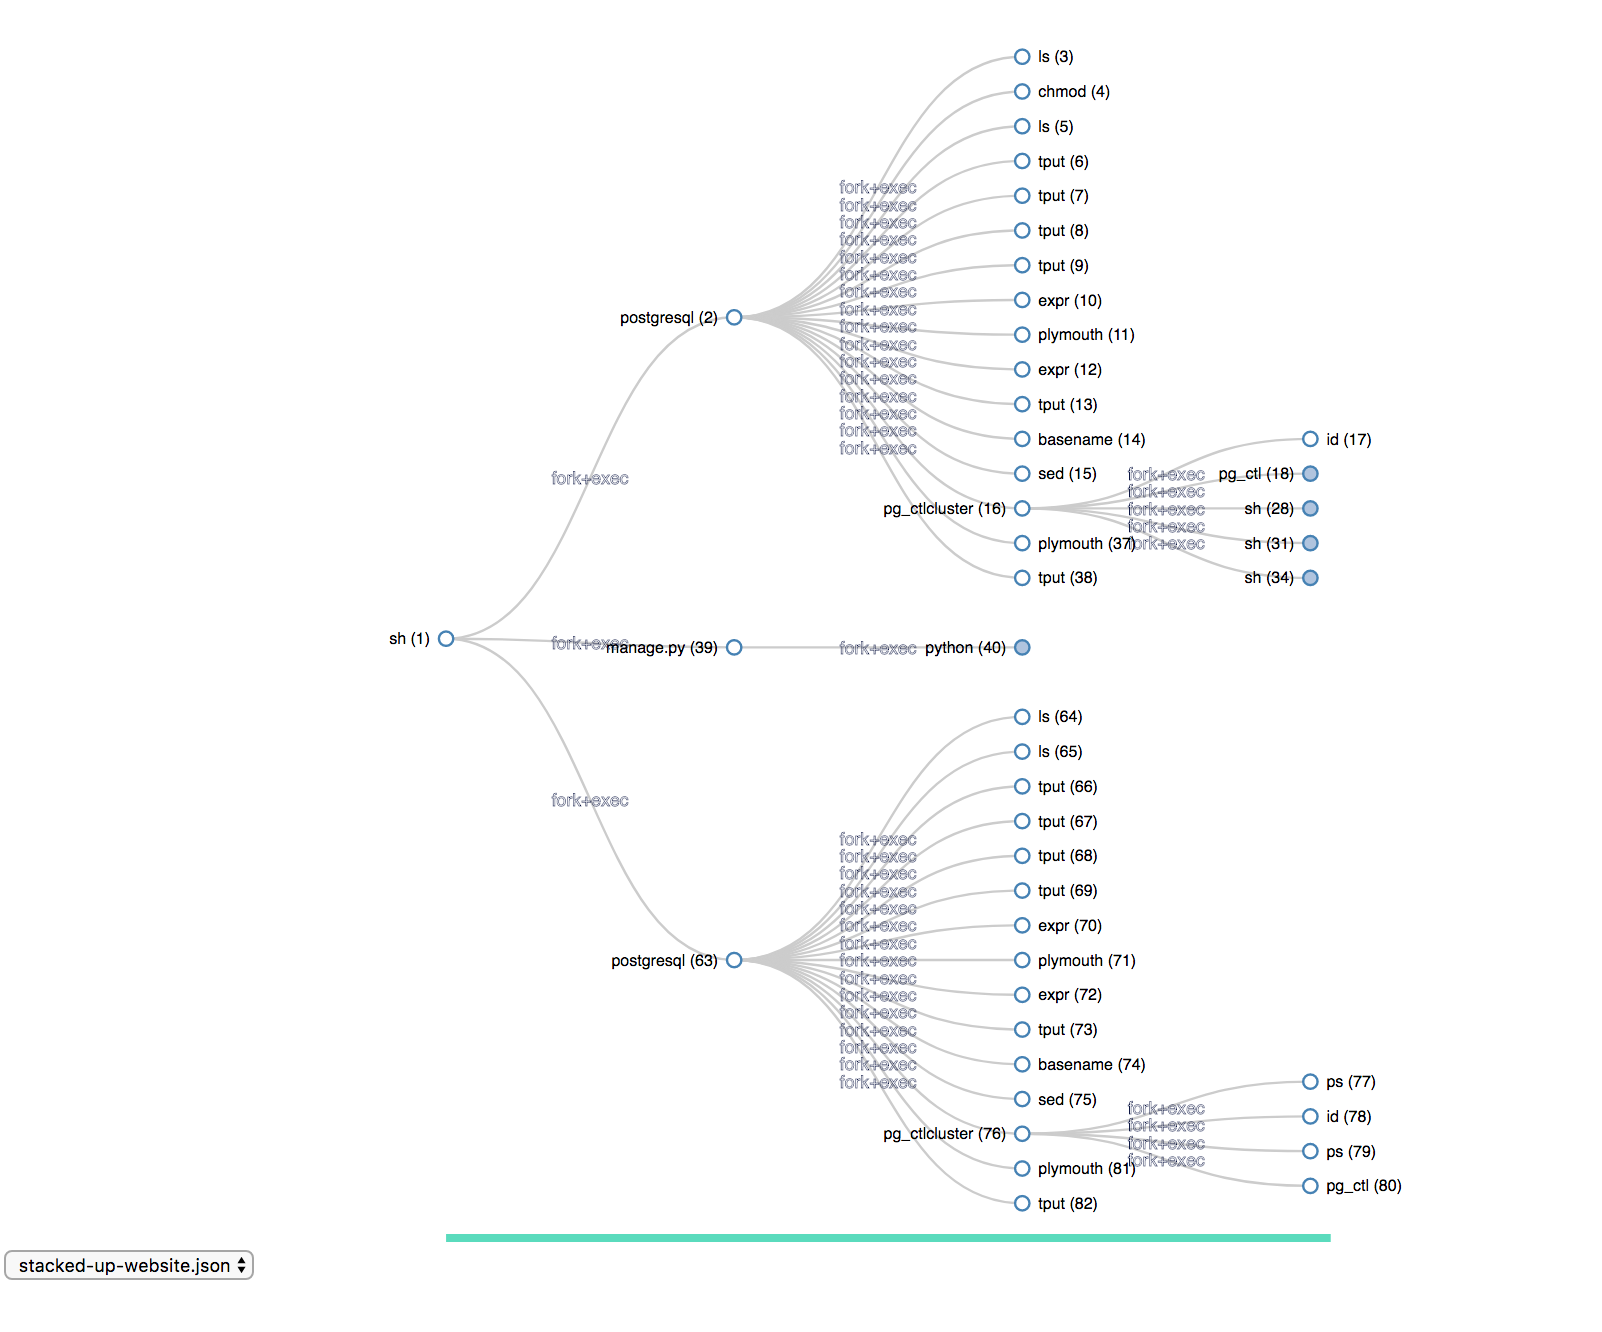
- Updated and enhanced the working prototype and uploaded to my personal Github for hosting. The gh-pages can be found here, please take a look.
- Reviewed the new json files with timestamps. I will start to look into how to incorporate the timestamp into the working prototype next week.
- For next week, I will need to revisit the markups with the new updates. And I will start working on the how to visualize the files and incorporate the time stamp into this working prototype
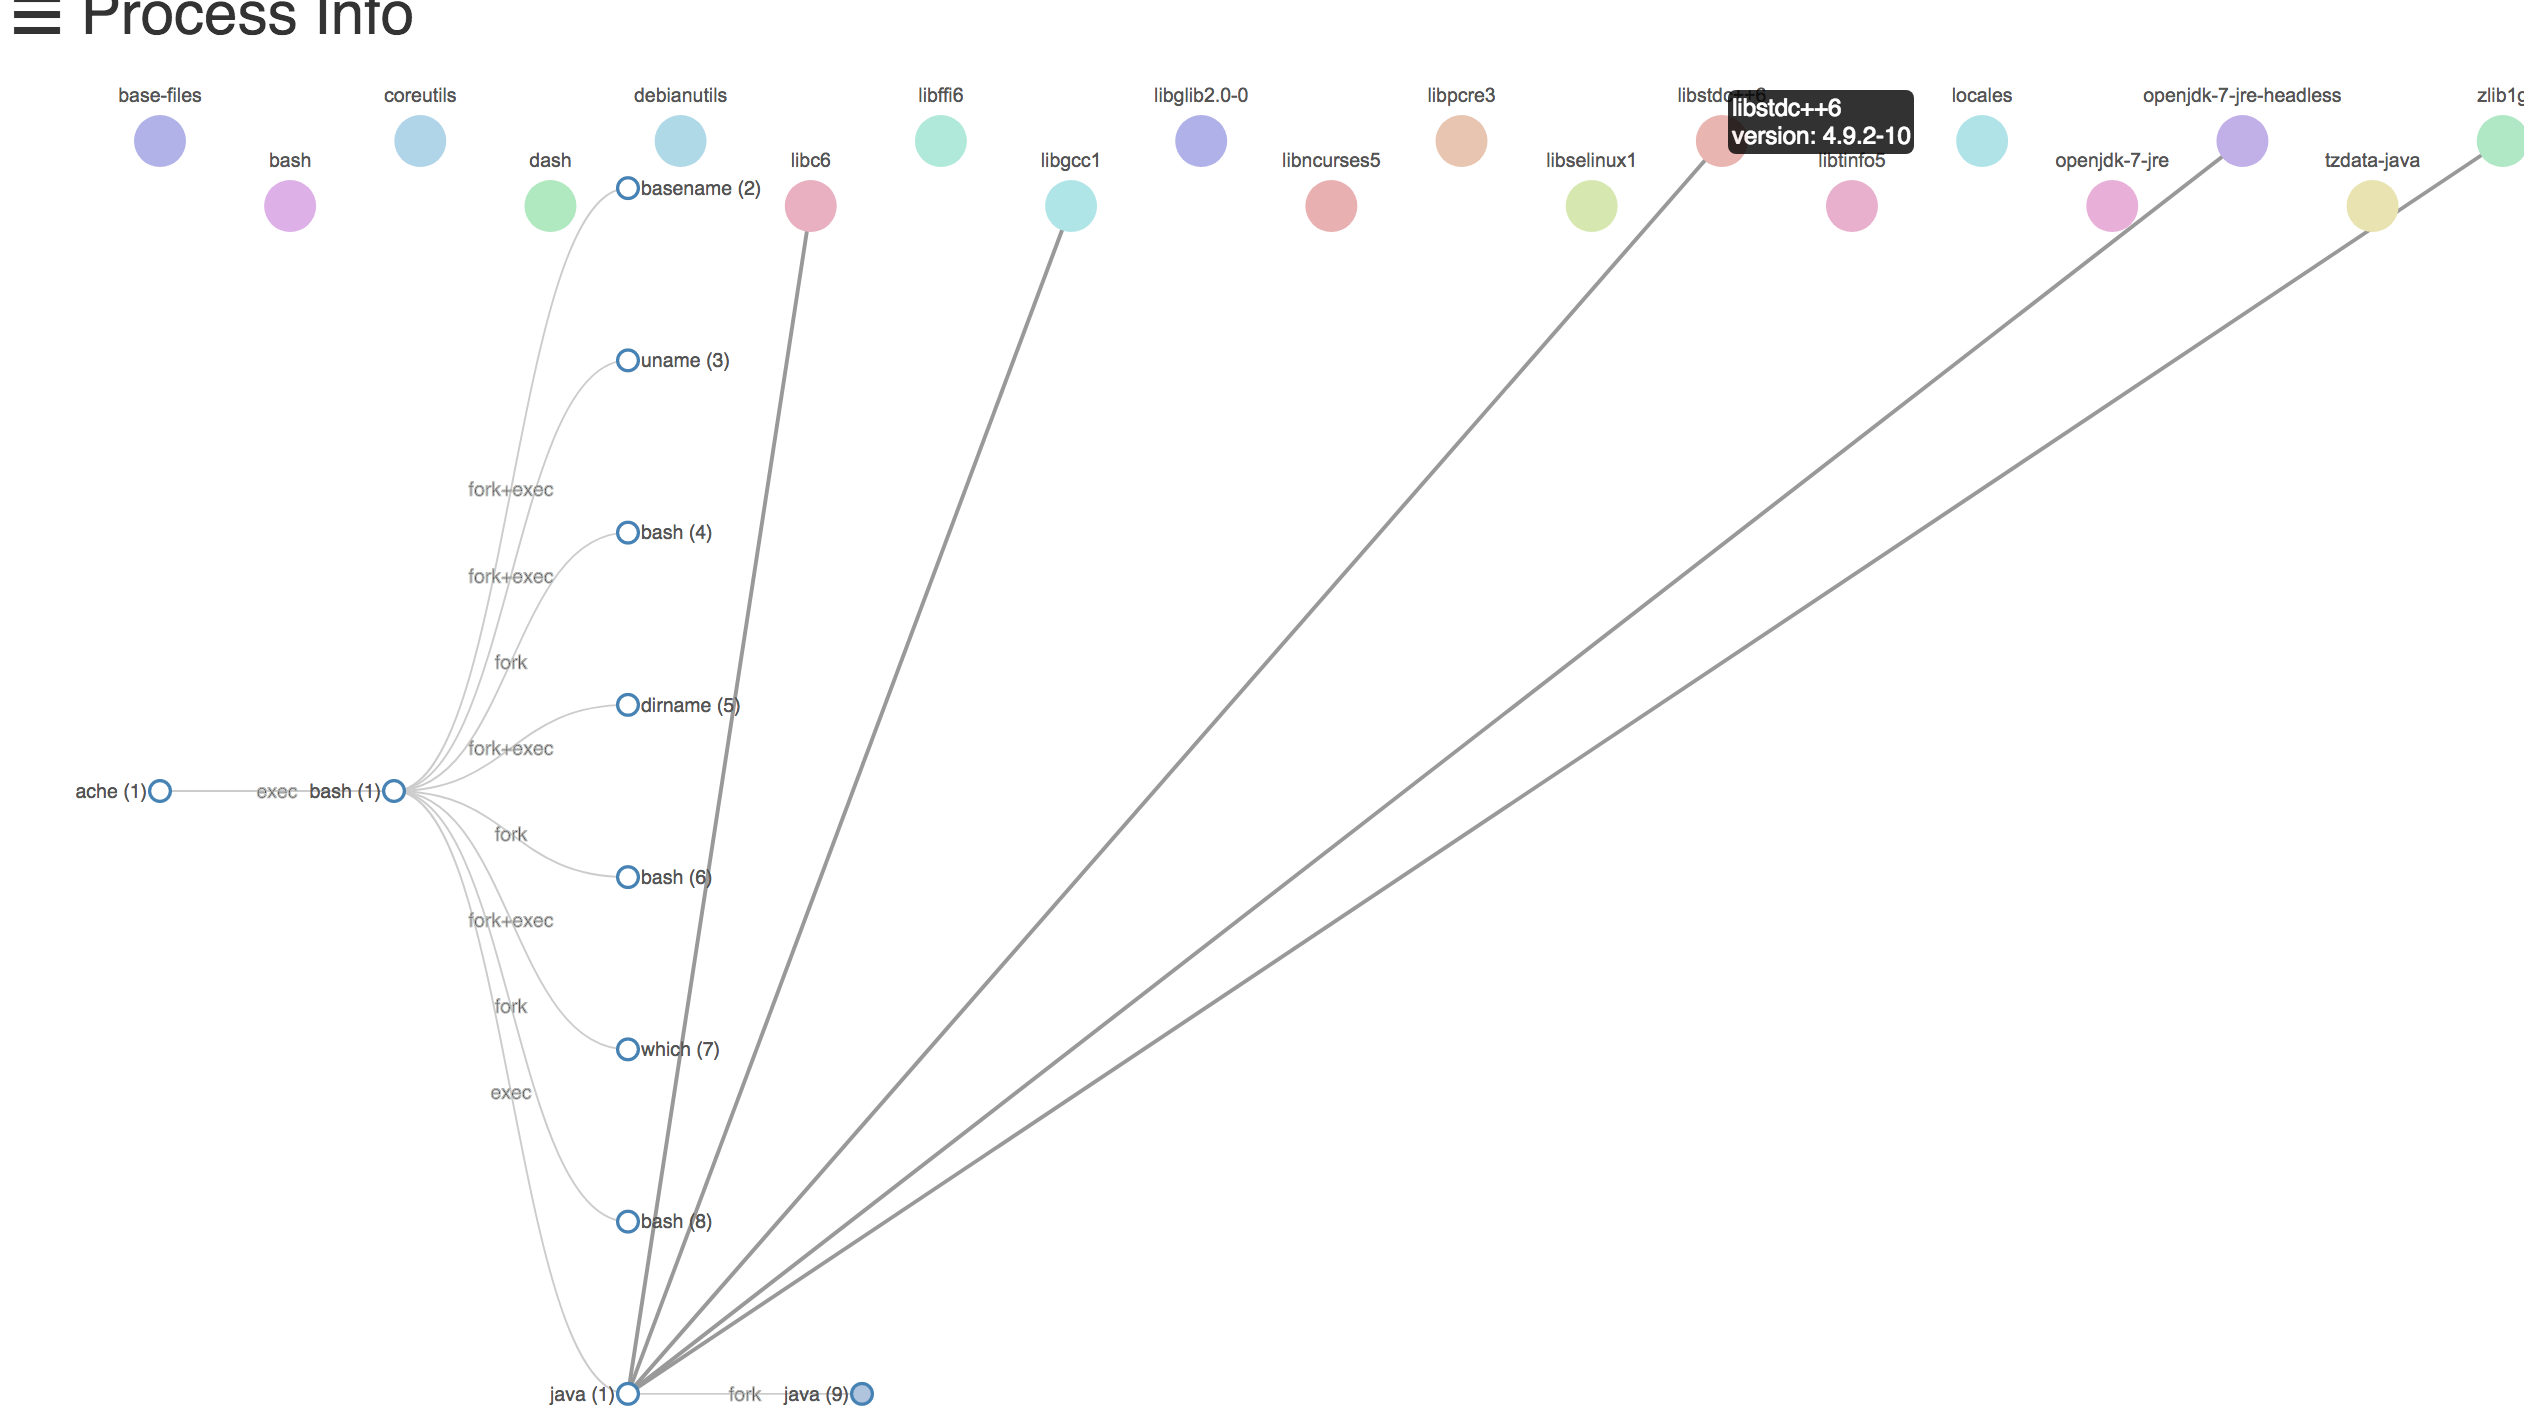
- Updated our visualization with mouse over to show the "description" details and enhanced our code to handle double click / single click for future interaction development
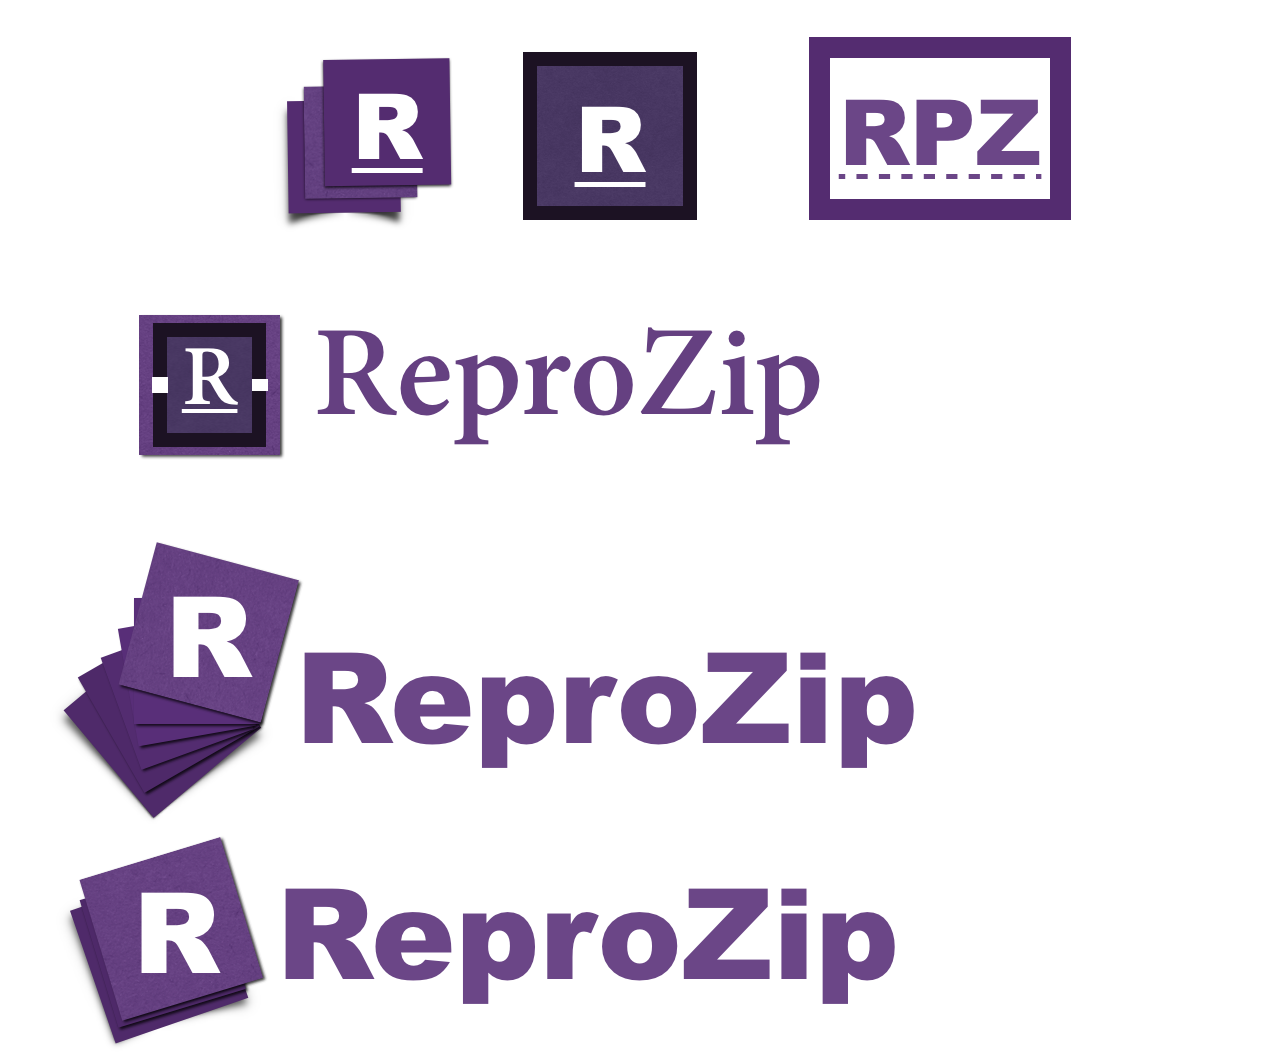
- Created the initial draft for our RaproZip Logo:

-
Designed the markedup for how to visualize files in the provenance graphs. After some research, I decided to achieve the visualization by using the force layout from D3.
-
Studying force layout from D3.
-
Started coding on on the force layout:
-
Continued to configure the D3 specified data structure to use the given json data.
-
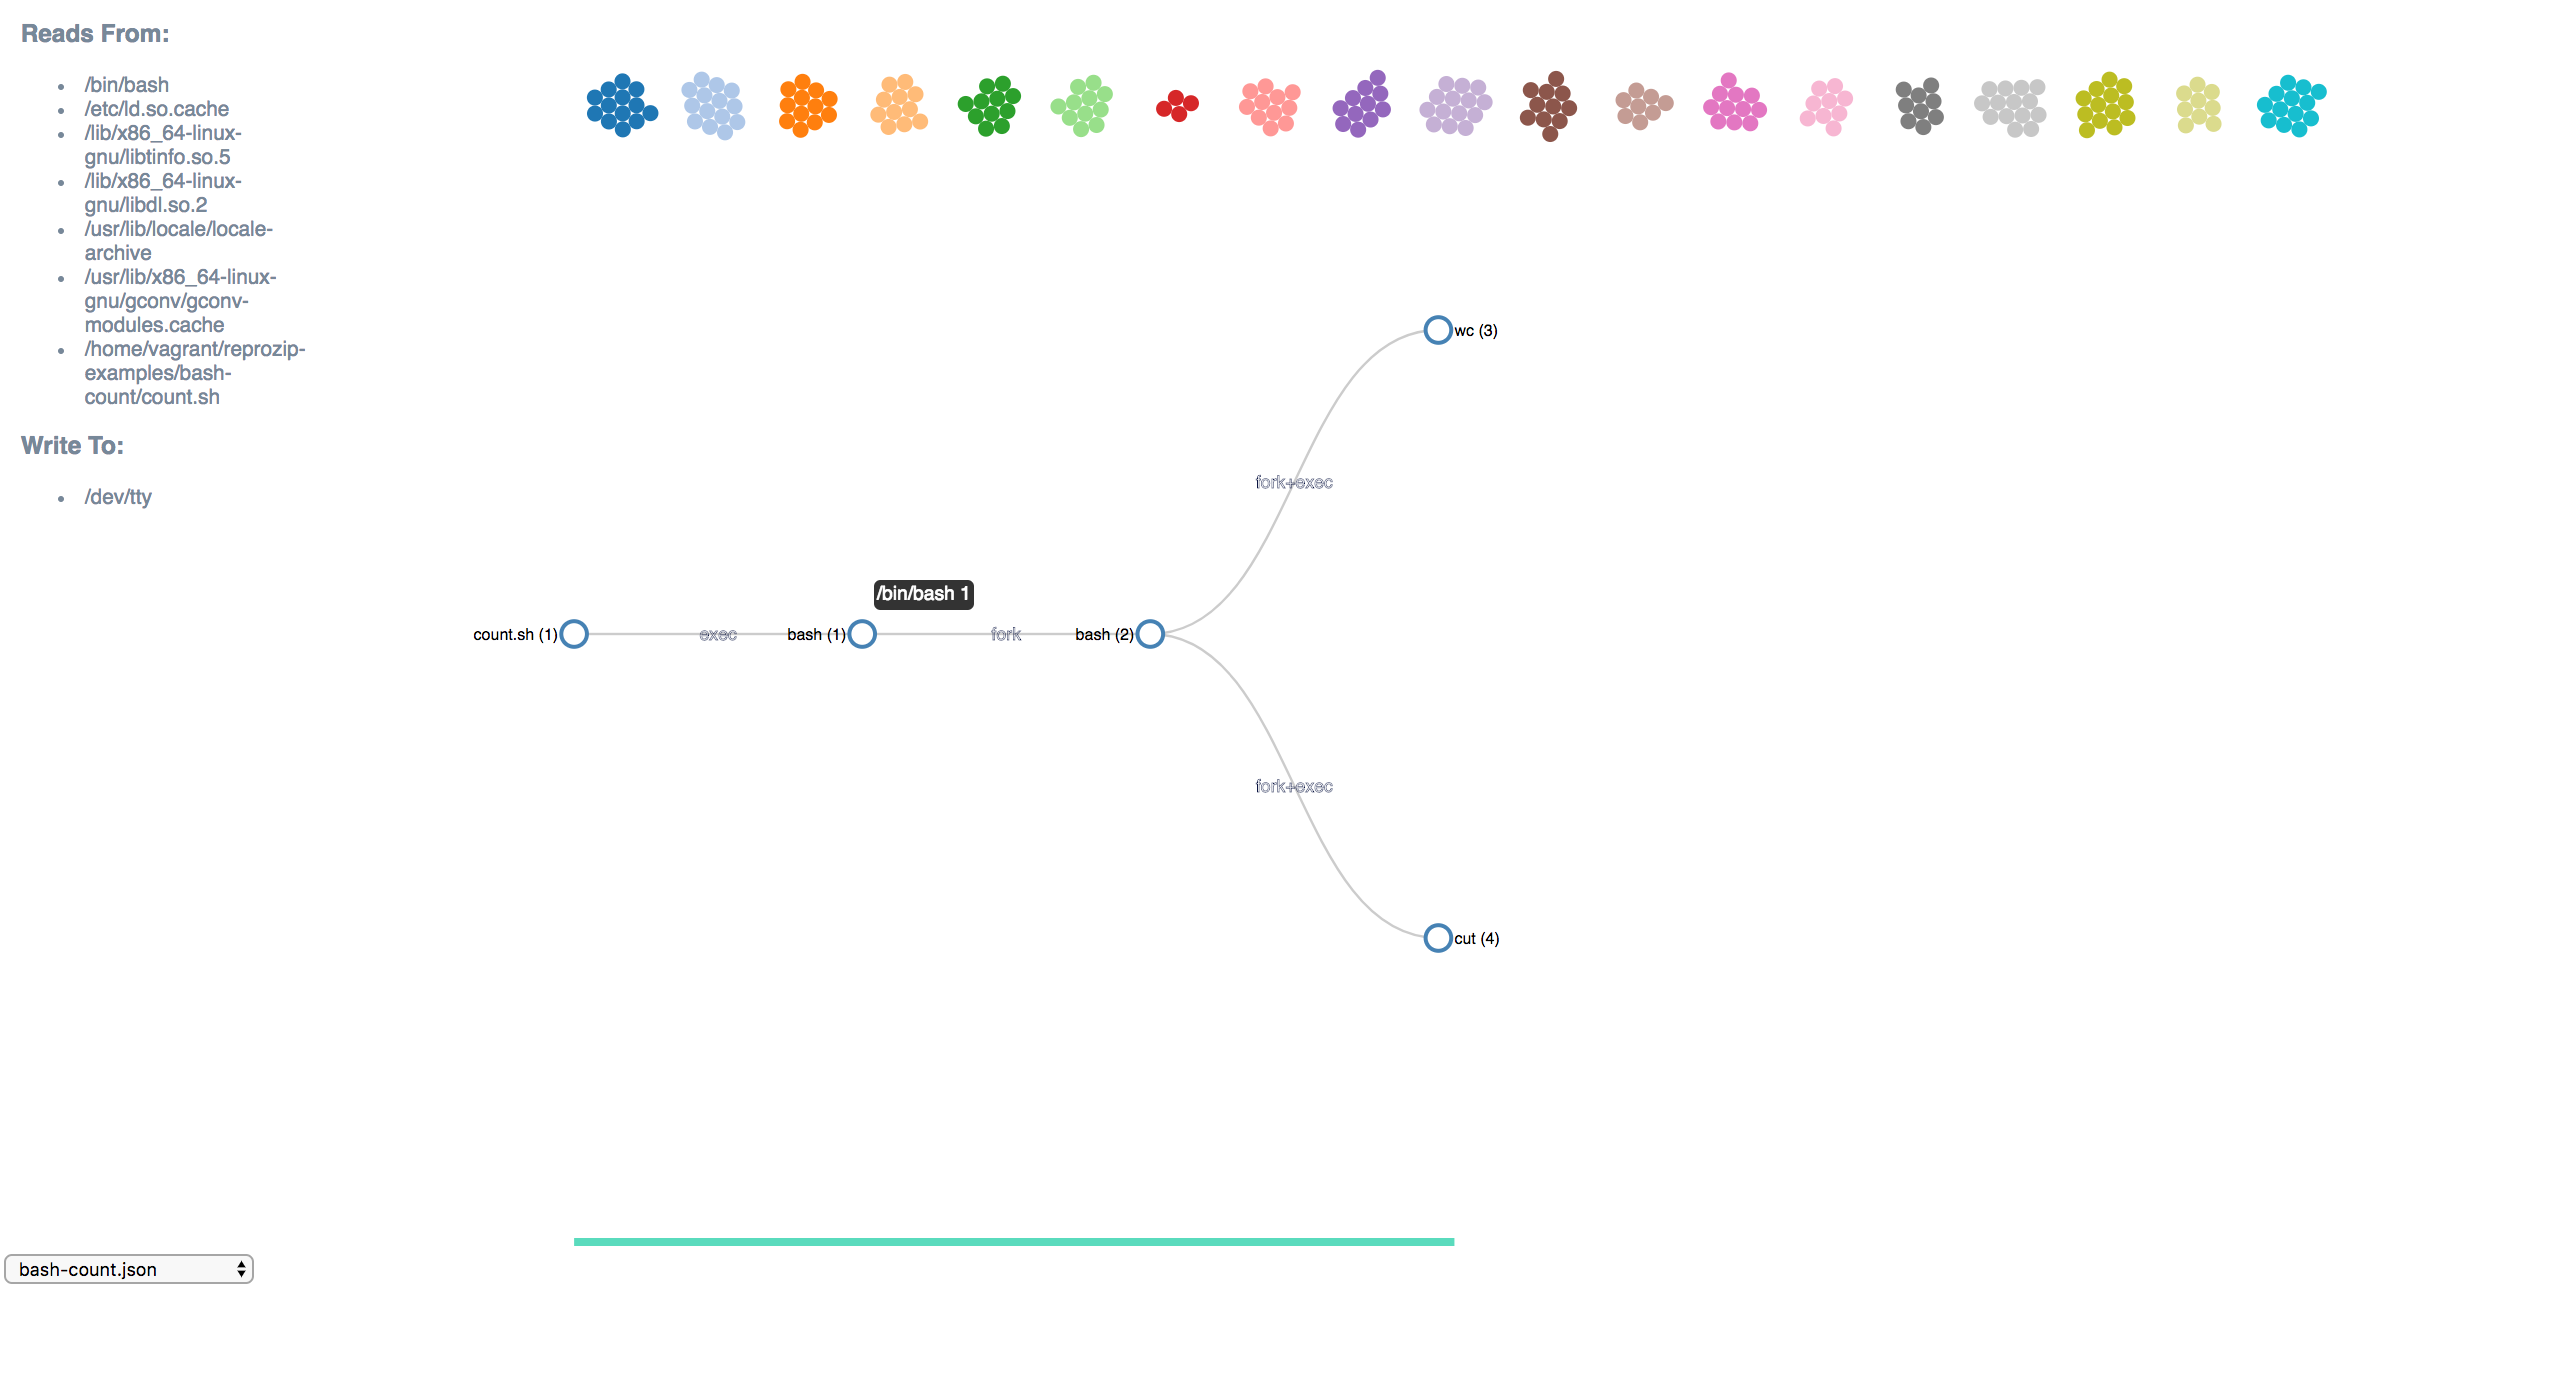
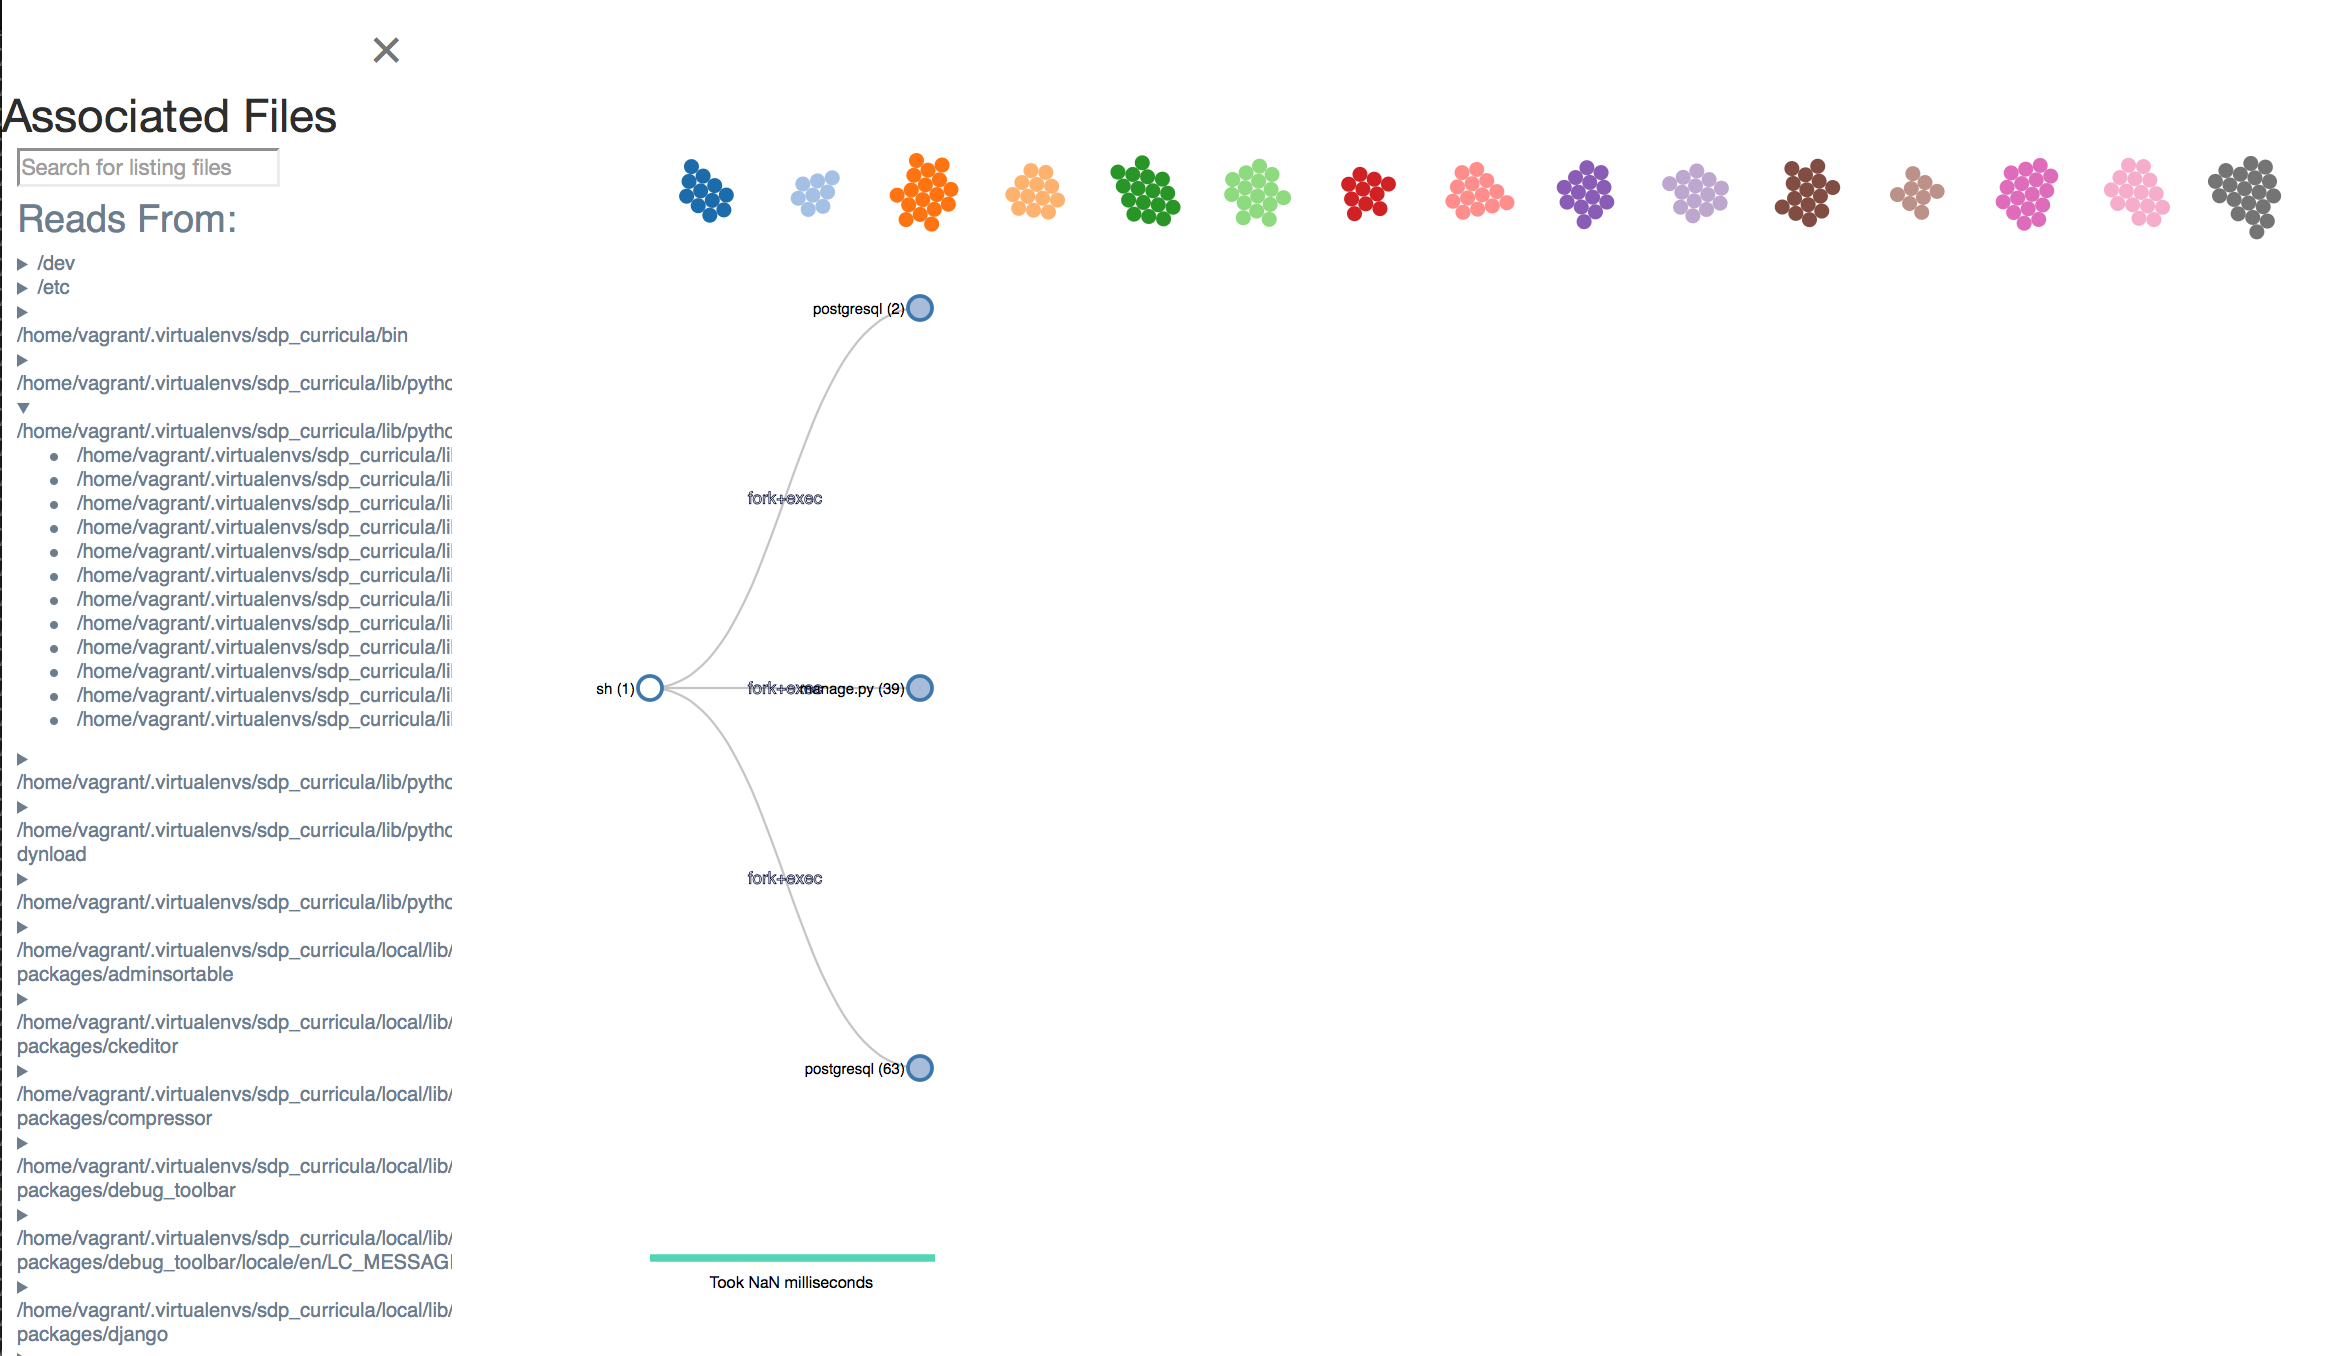
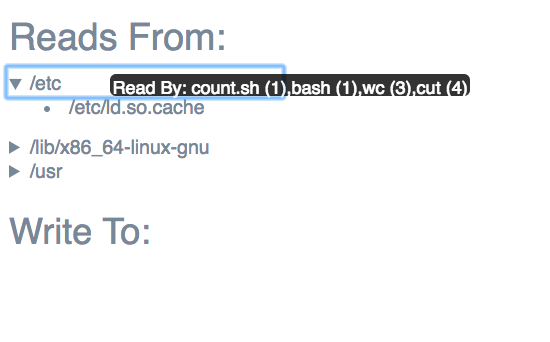
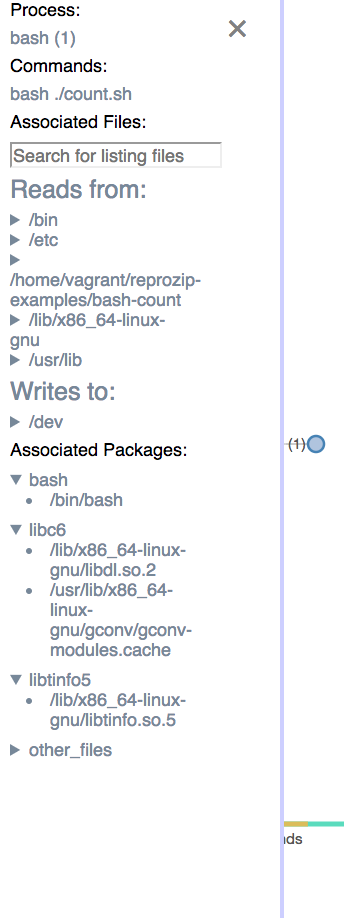
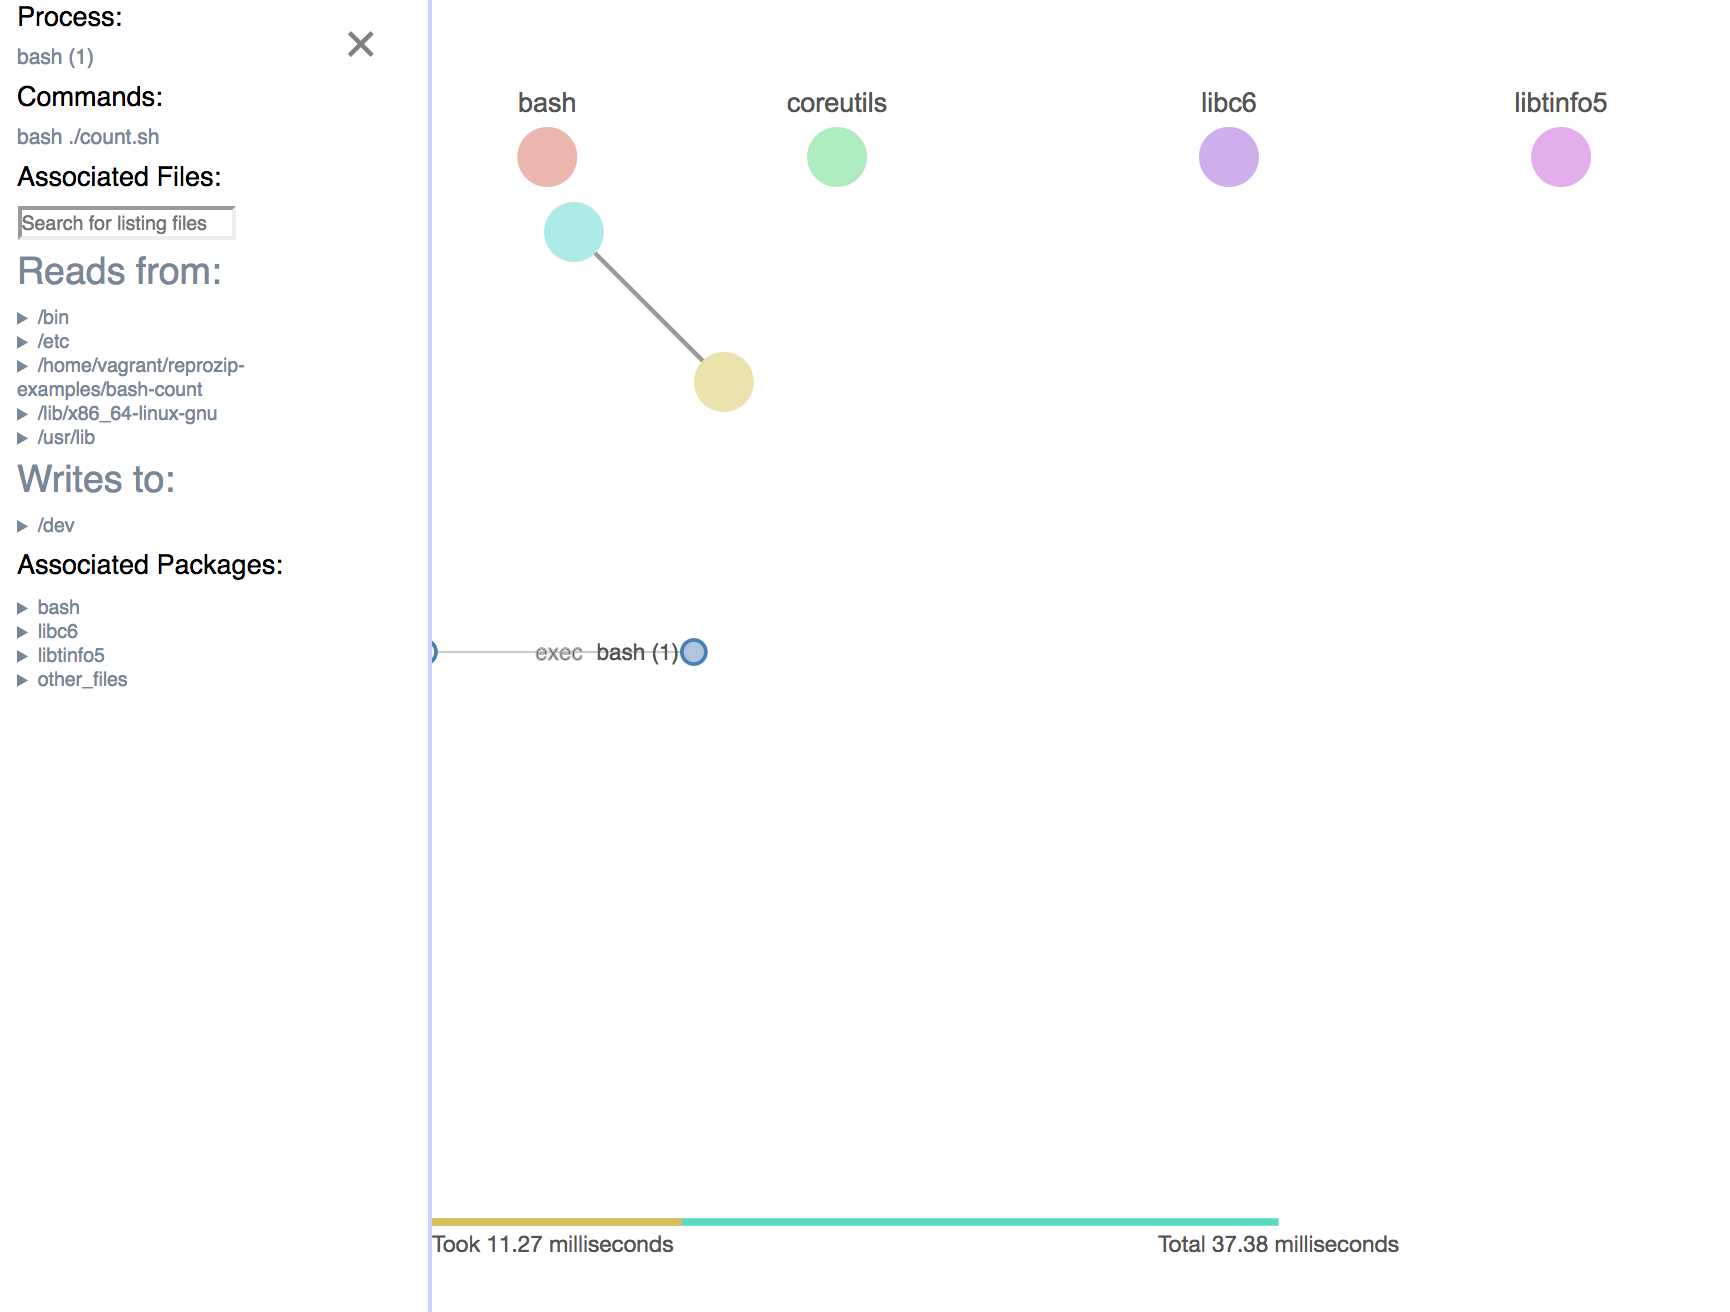
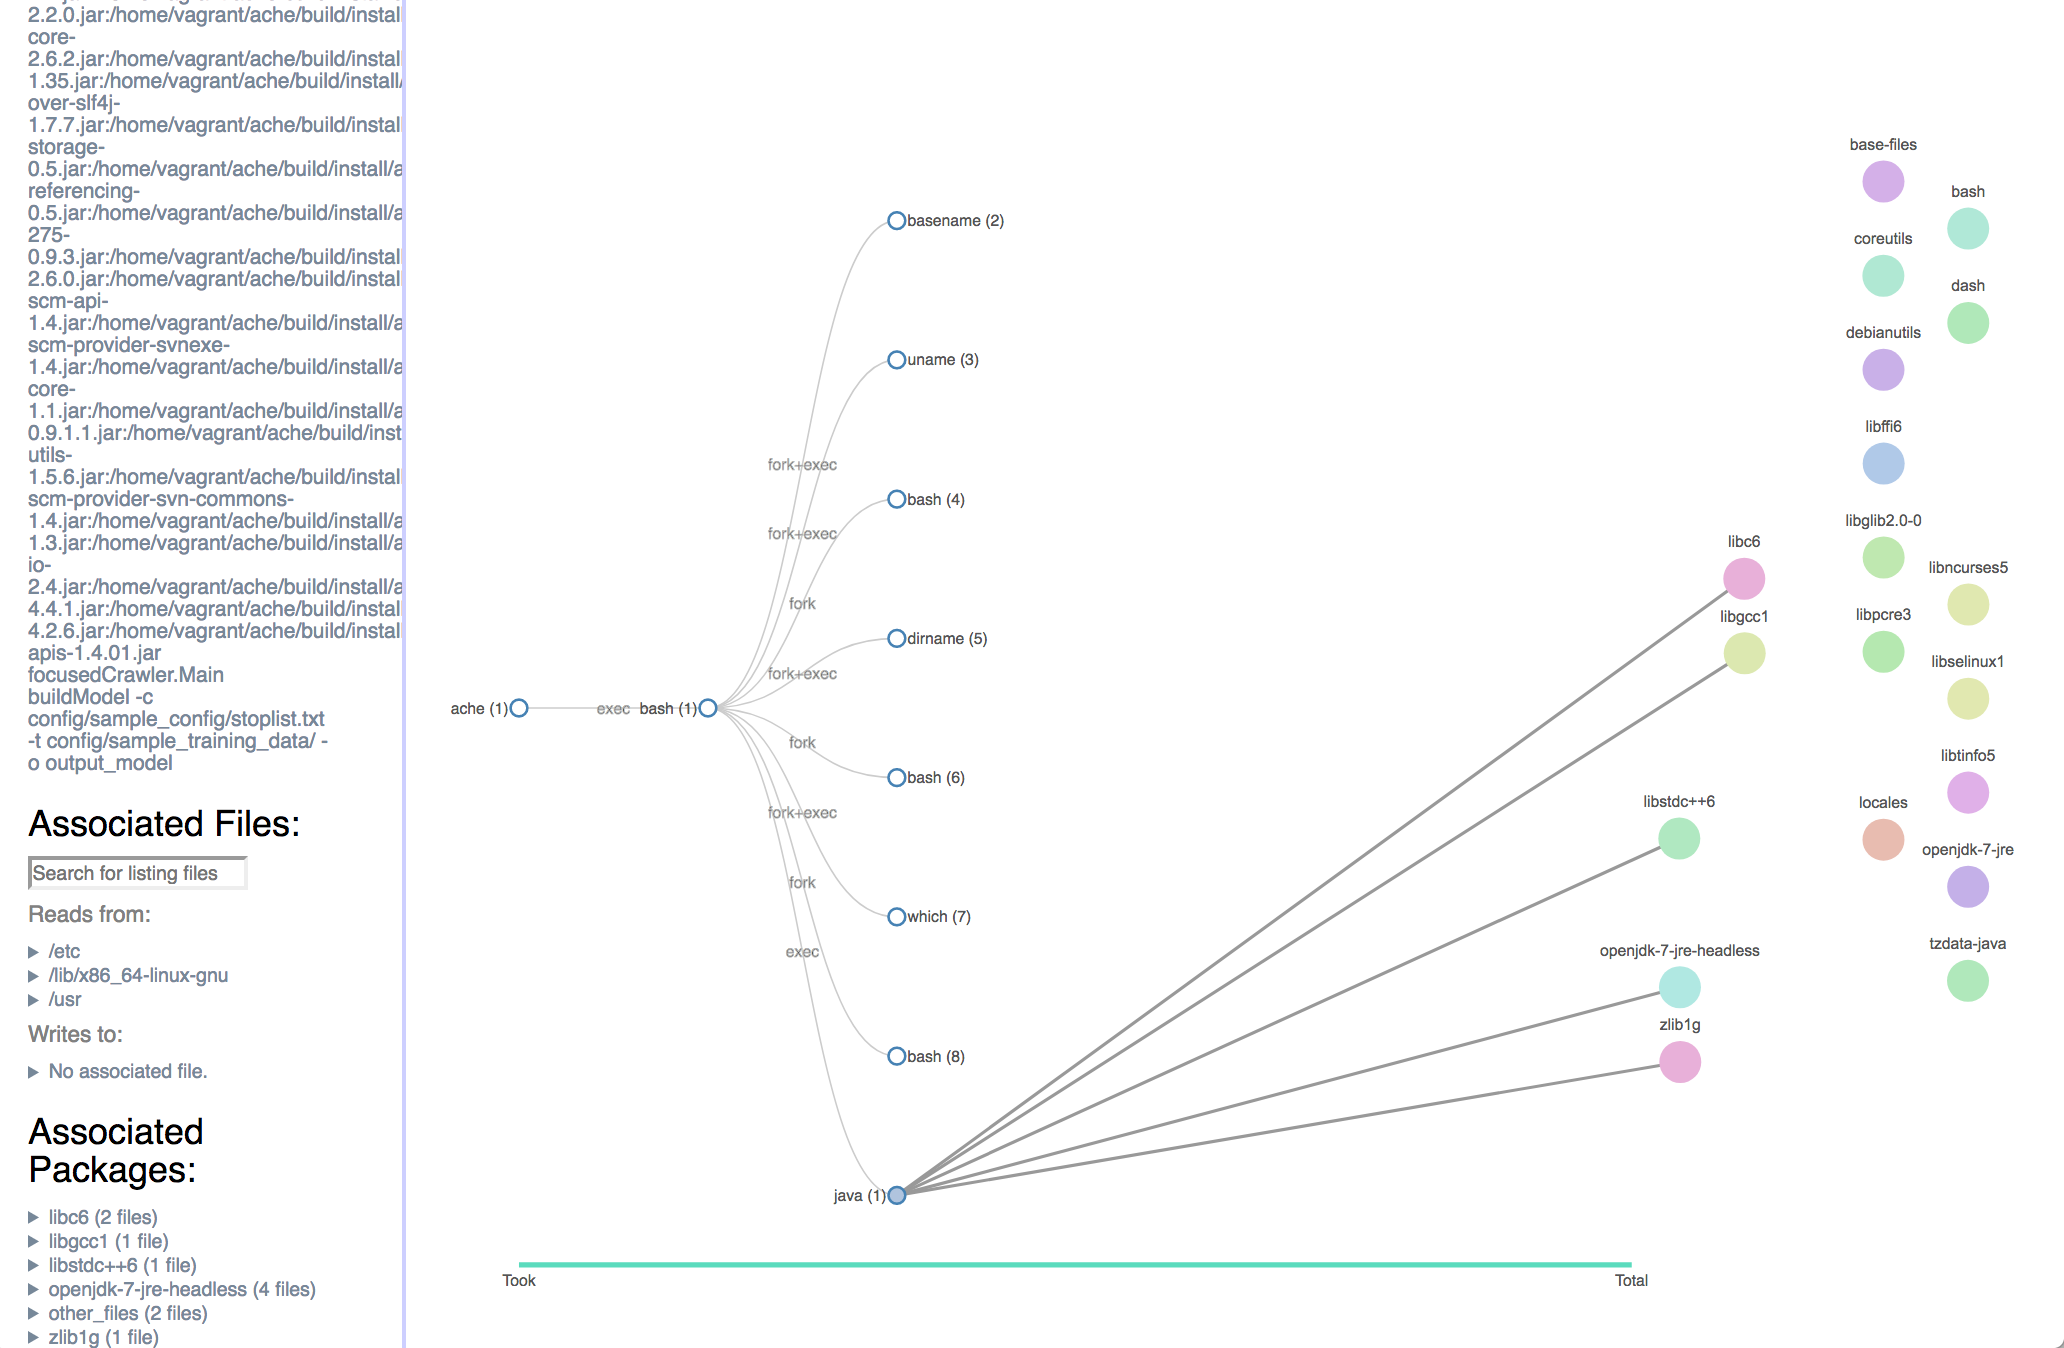
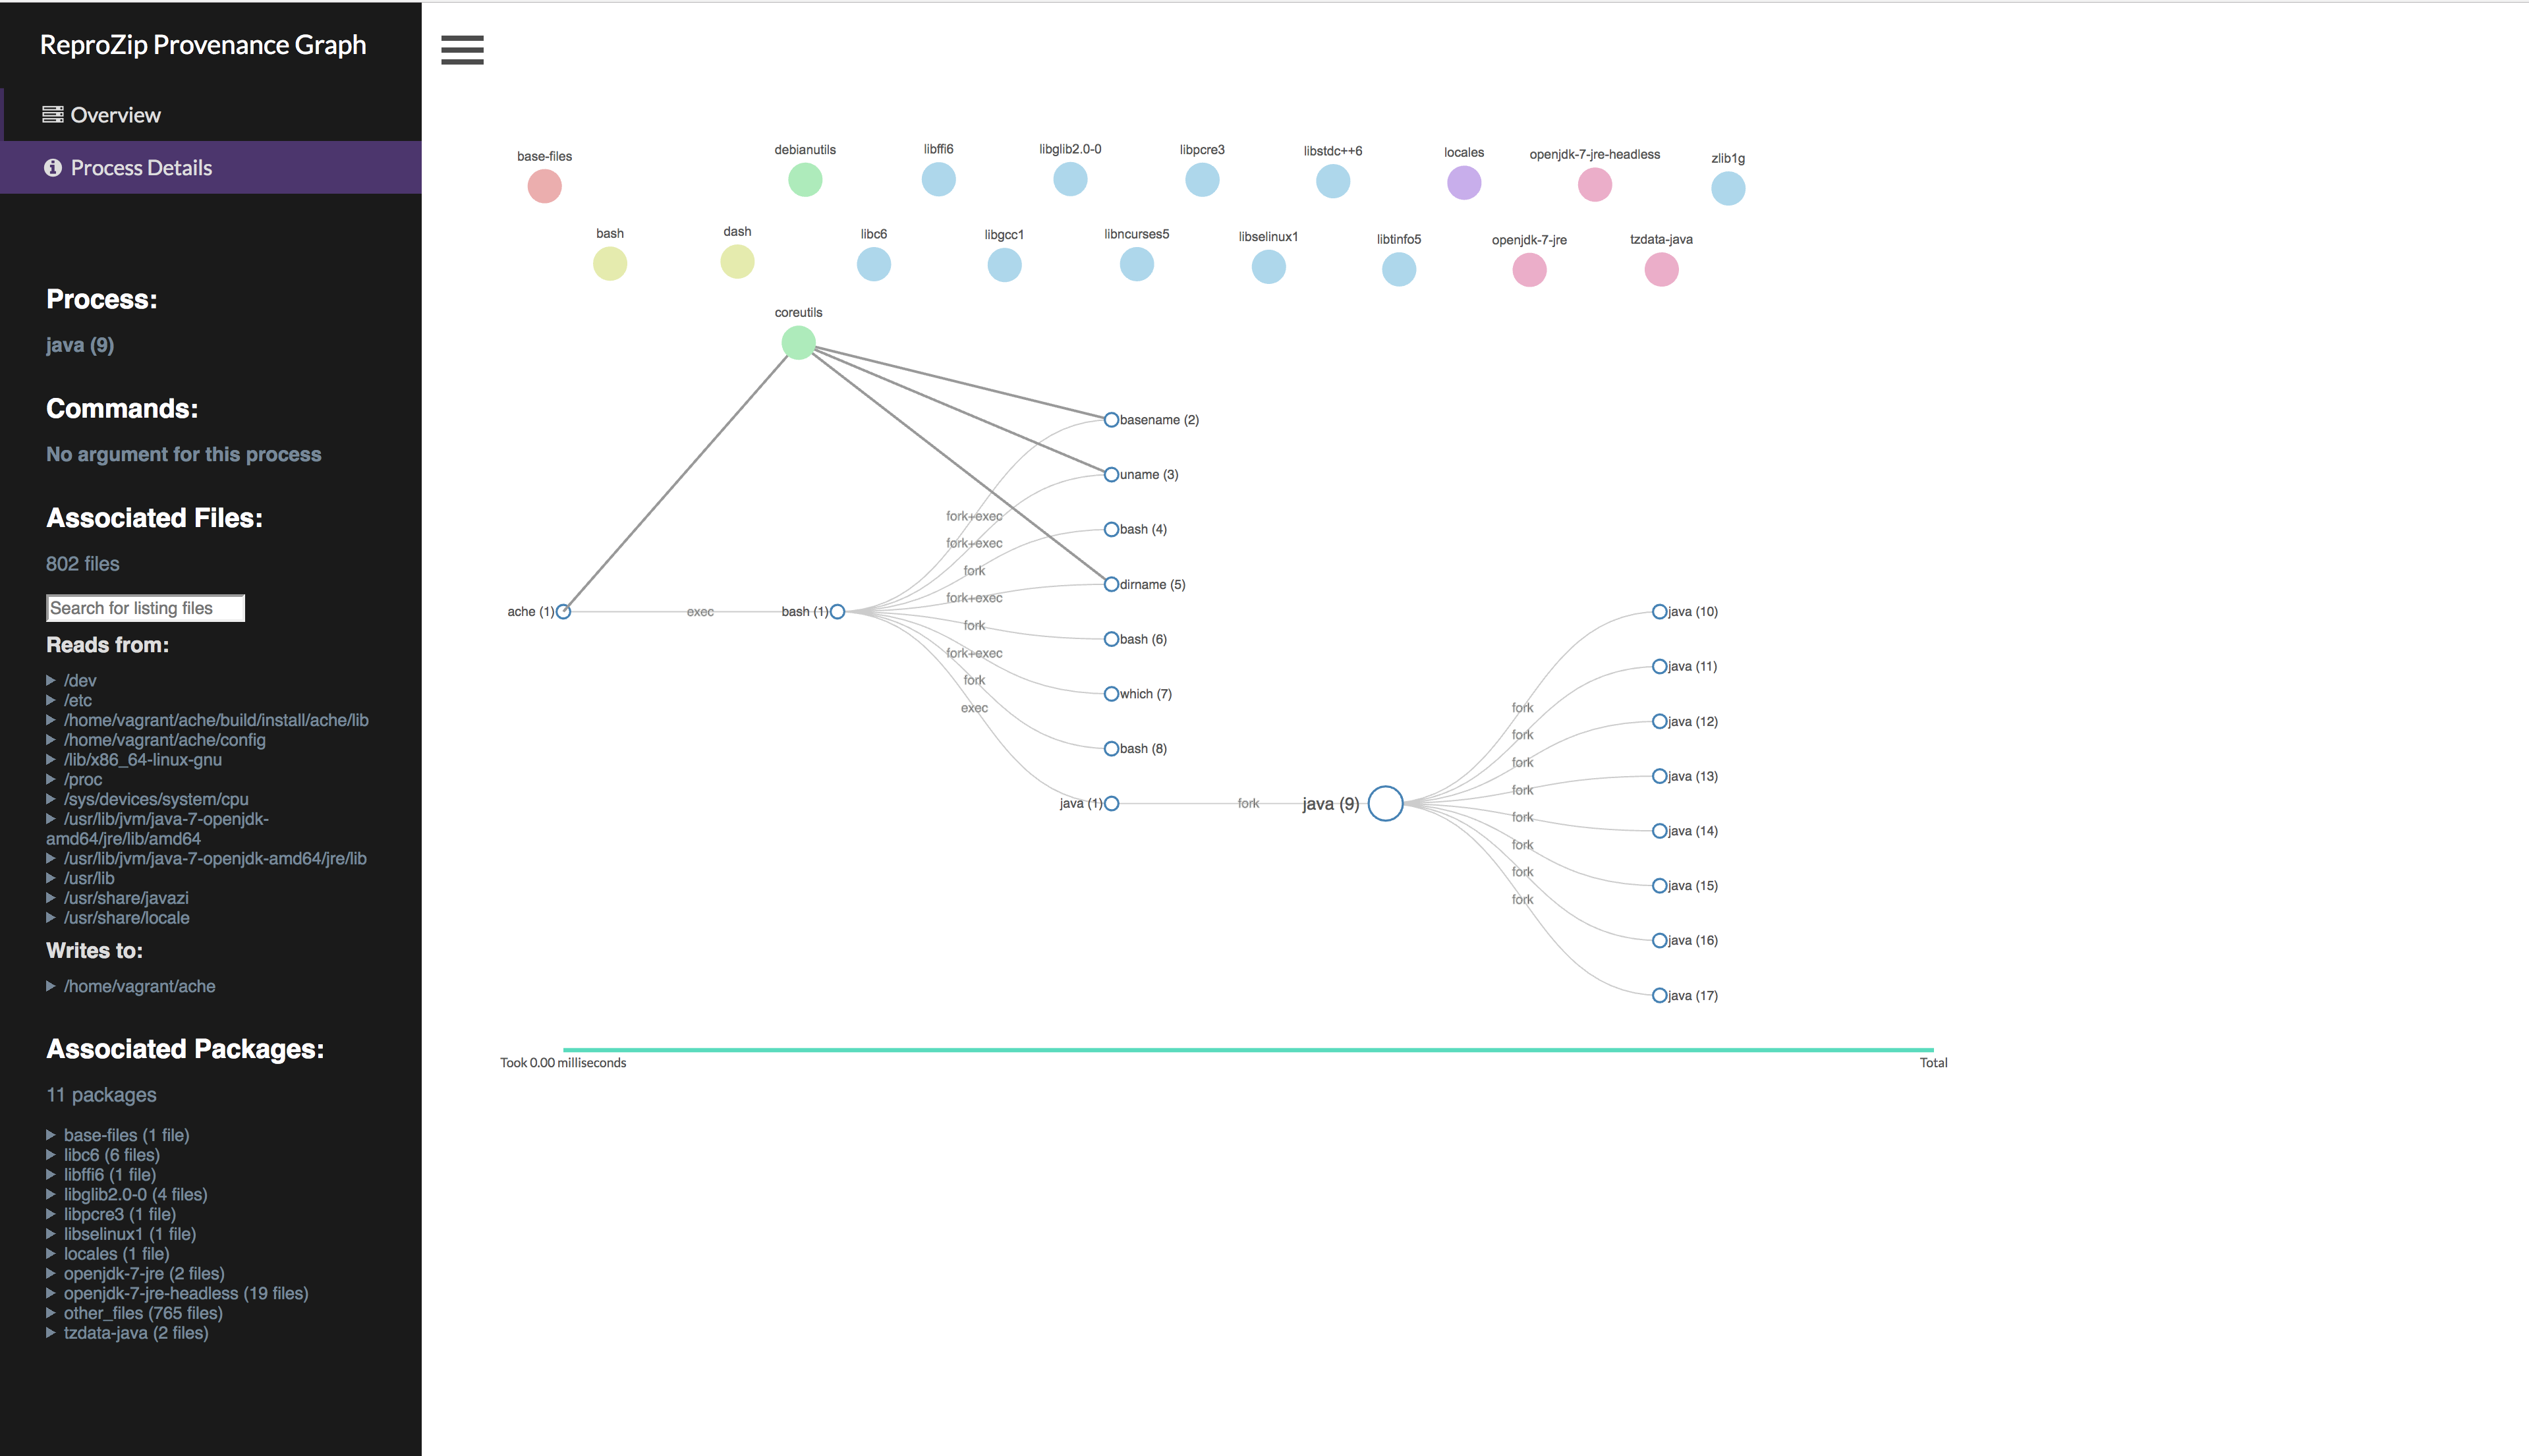
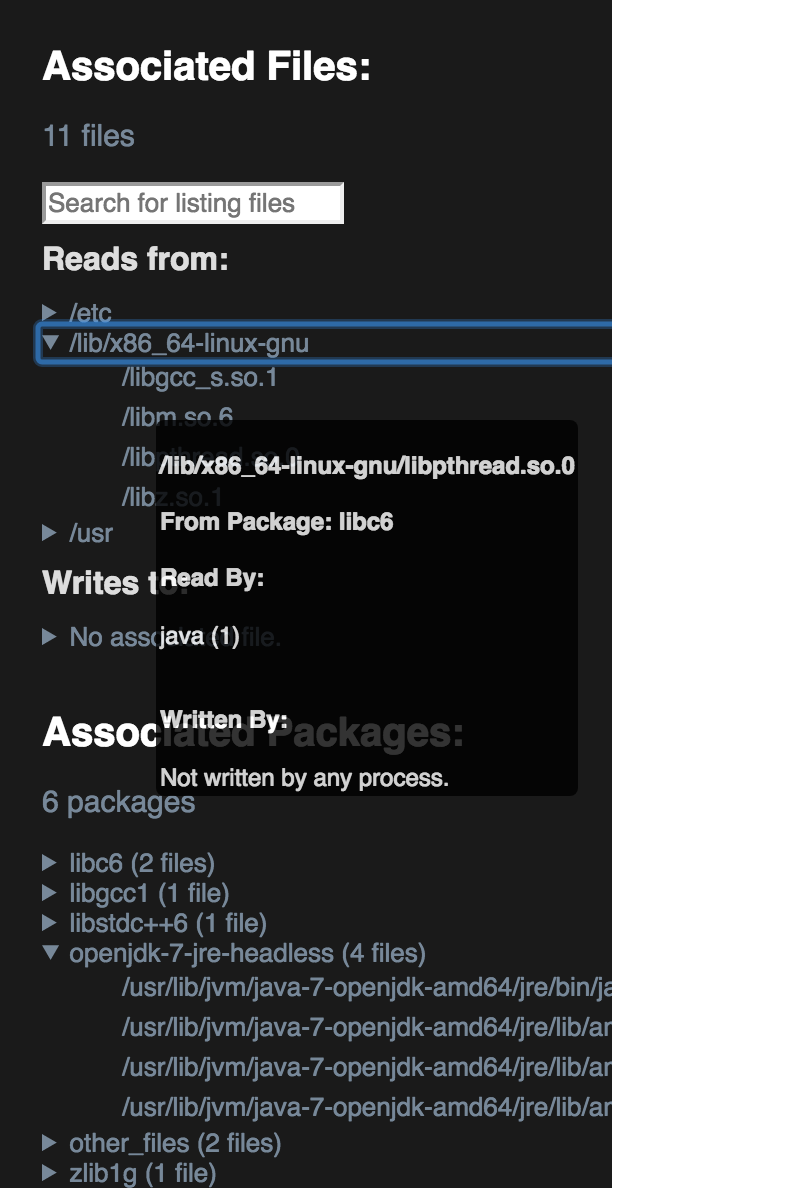
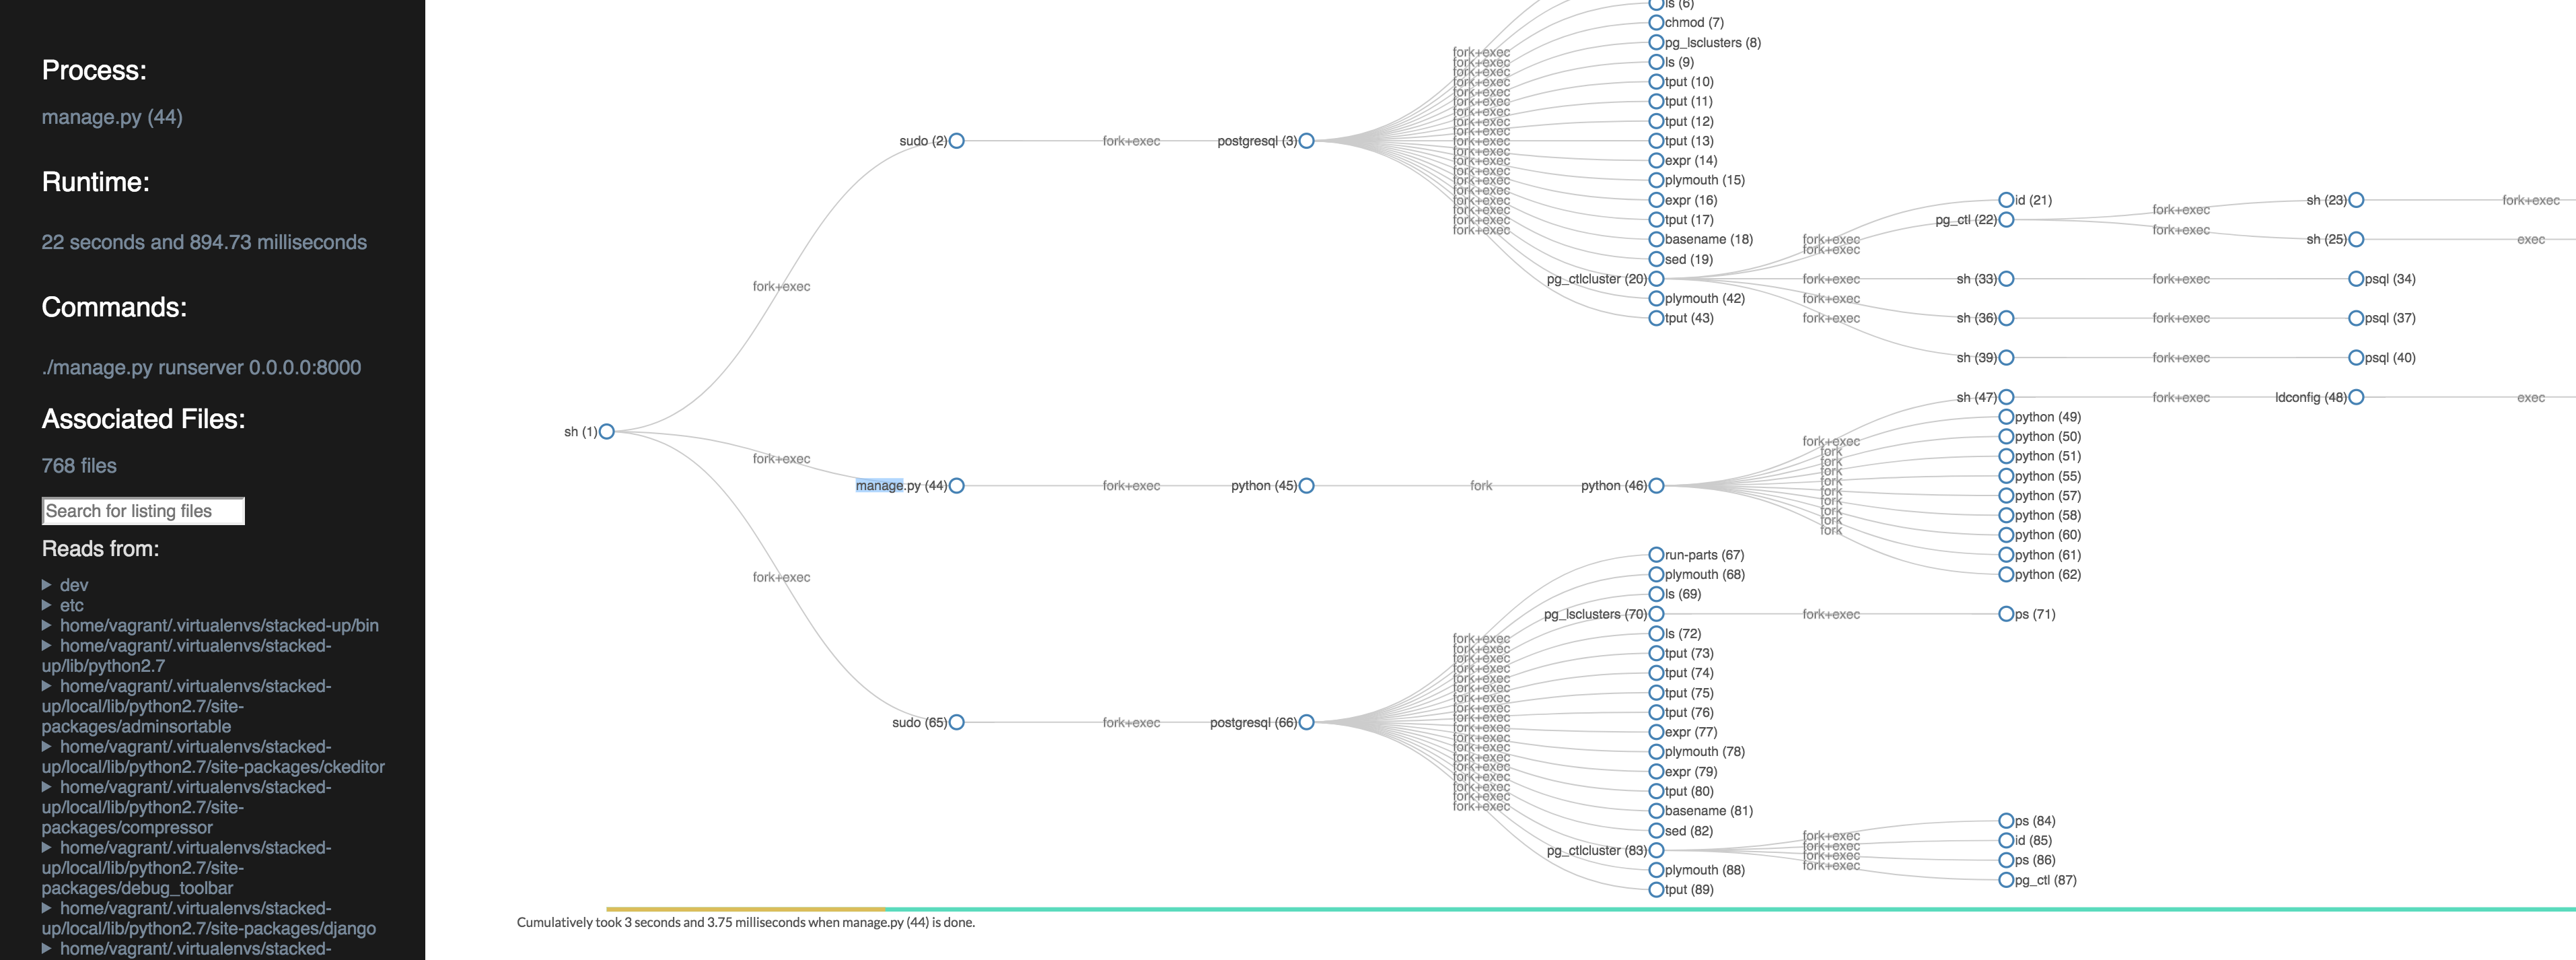
To ensure we can accomplish the task for this week for listing files, I took what Remi and Vicky suggested in the morning meeting to list the reads from and writes to files by clicking on the process.
-
Updated and enhanced the working prototype and uploaded to my personal Github for hosting. The gh-pages can be found here, please take a look.
-
And I also managed to create few logo markups
- Updated our visualization to show the time on the timeline by using the timestamps on the the json file.
- Designed the markedup for side panel by studying the best practices from The Webby Awards. After some research, I decided to achieve the visualization by using the navigation panel from The Intercept_. (https://theintercept.com)
- Tried to fix the bug of the time line not align with the tree diagram when collapsed and expanded the diagram from the nodes that is 1 level down from the very last node that just expanded. This bug should be able to fix by next Monday.
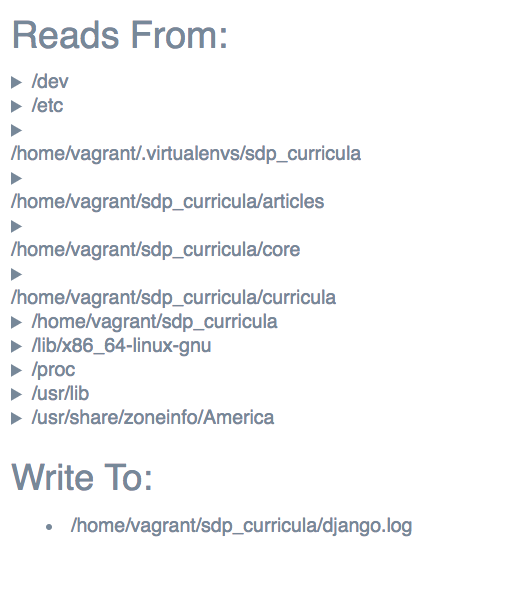
- Updating side panel to let a range of files to group by the shortest common path. I designed he algorithm and implementing it on the coming Monday.
- I have designed another set of ReproZip logos markups with the team's feedbacks. Please take a look:
- Implemented the data-structure group files by the shortest common path
- Implemented the data-structure for files. We now can use the file objects that contain the meta data
- Update and enhanced the side bar to incorporate with the data-structure of both files and group of files.
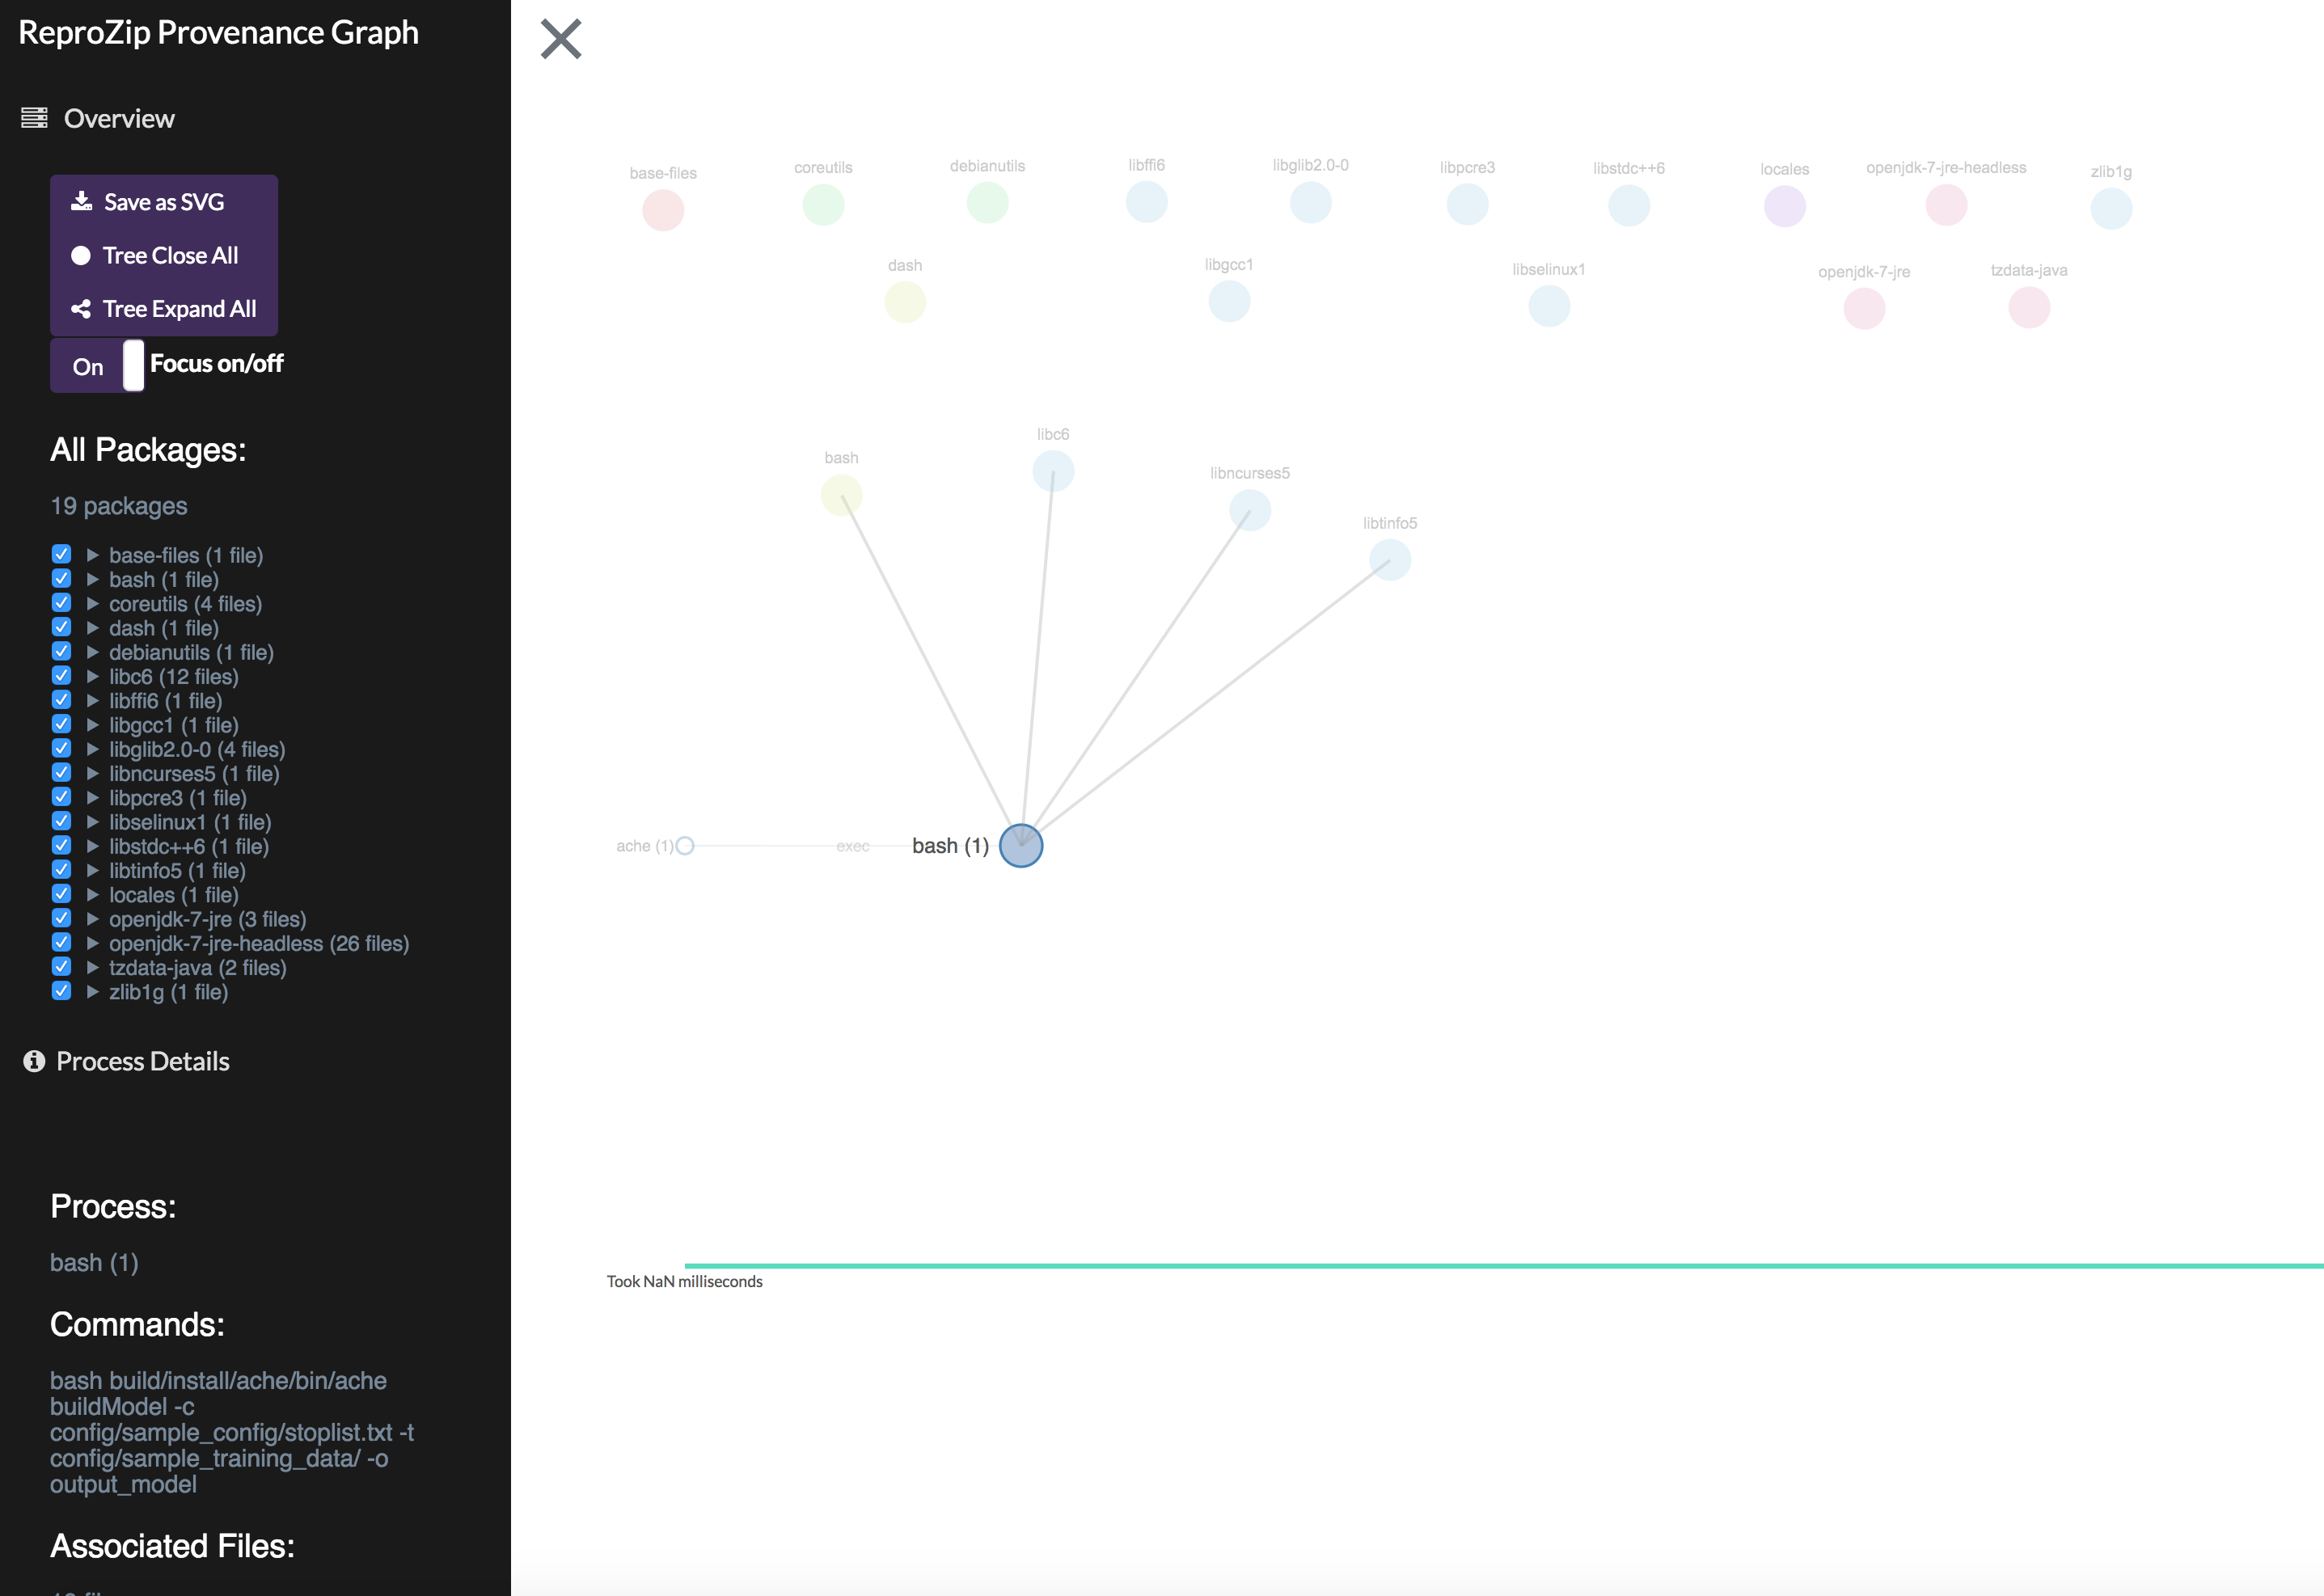
- Added /visualize the commands that the selected process use to the side panel
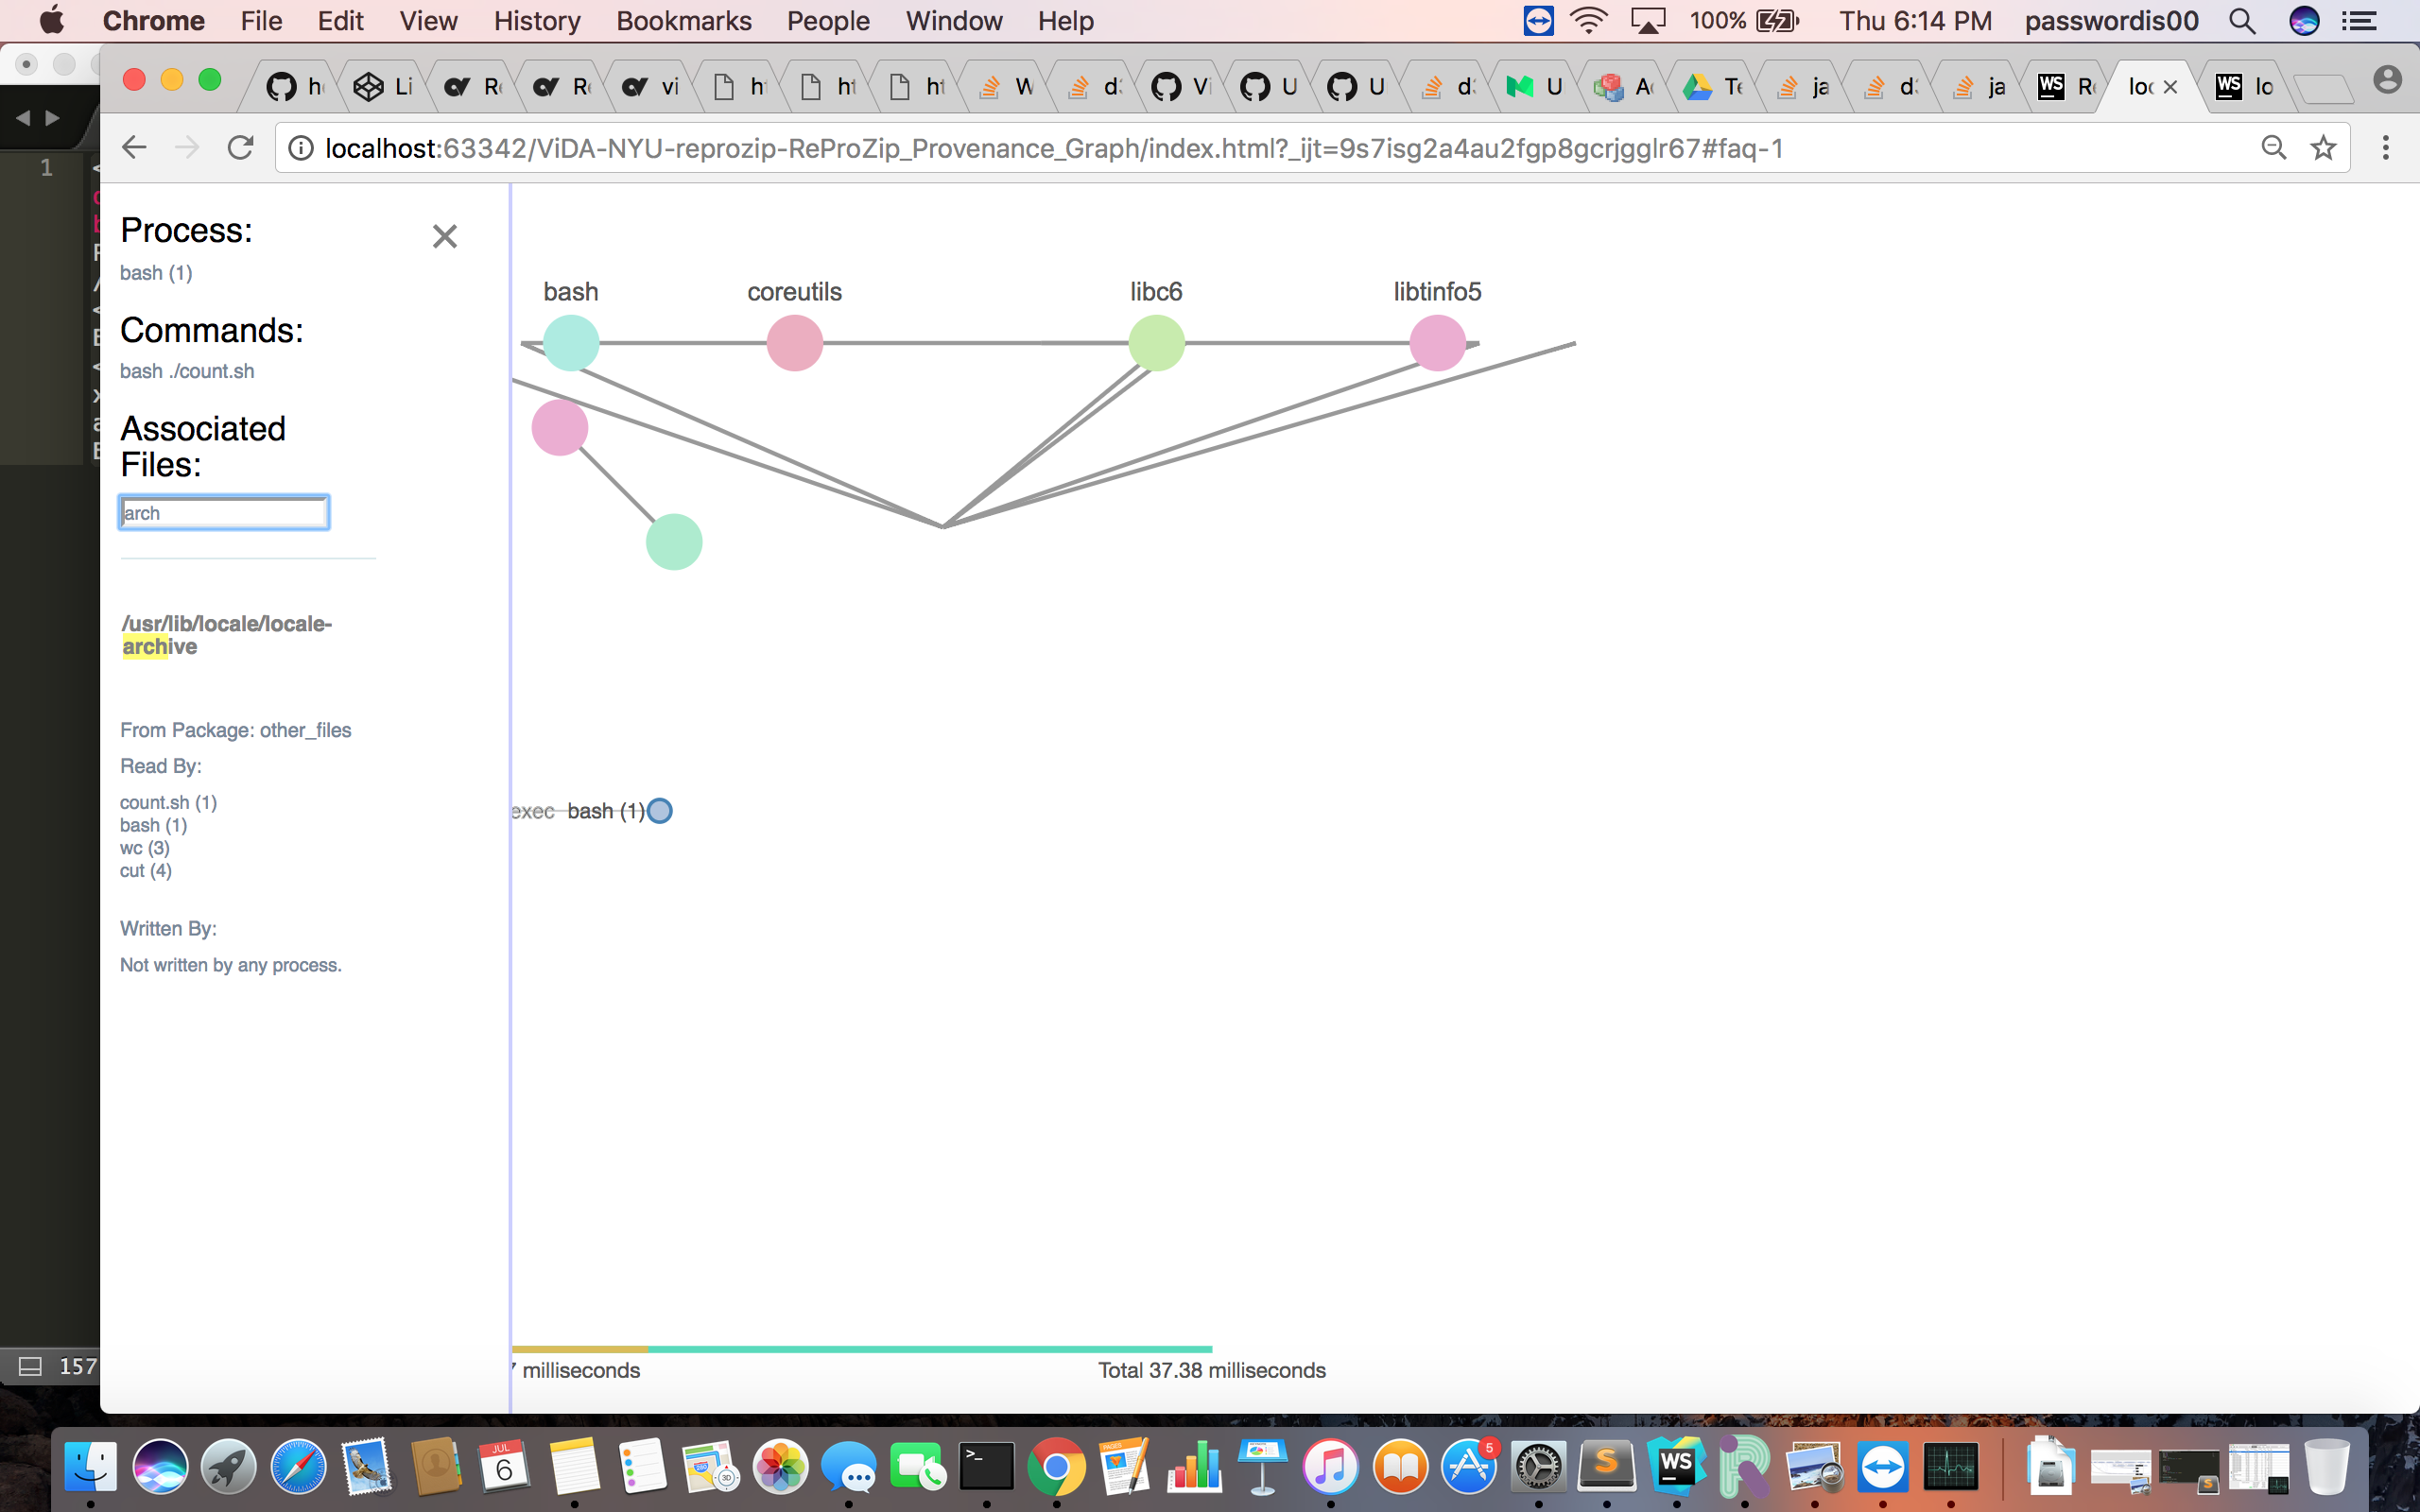
- Continue working on the file search function
- Work on shorten the file path within the group of listing files
- Working on double click to select the entire file with their proper path incase if user wants to copy and paste the file path for other usage
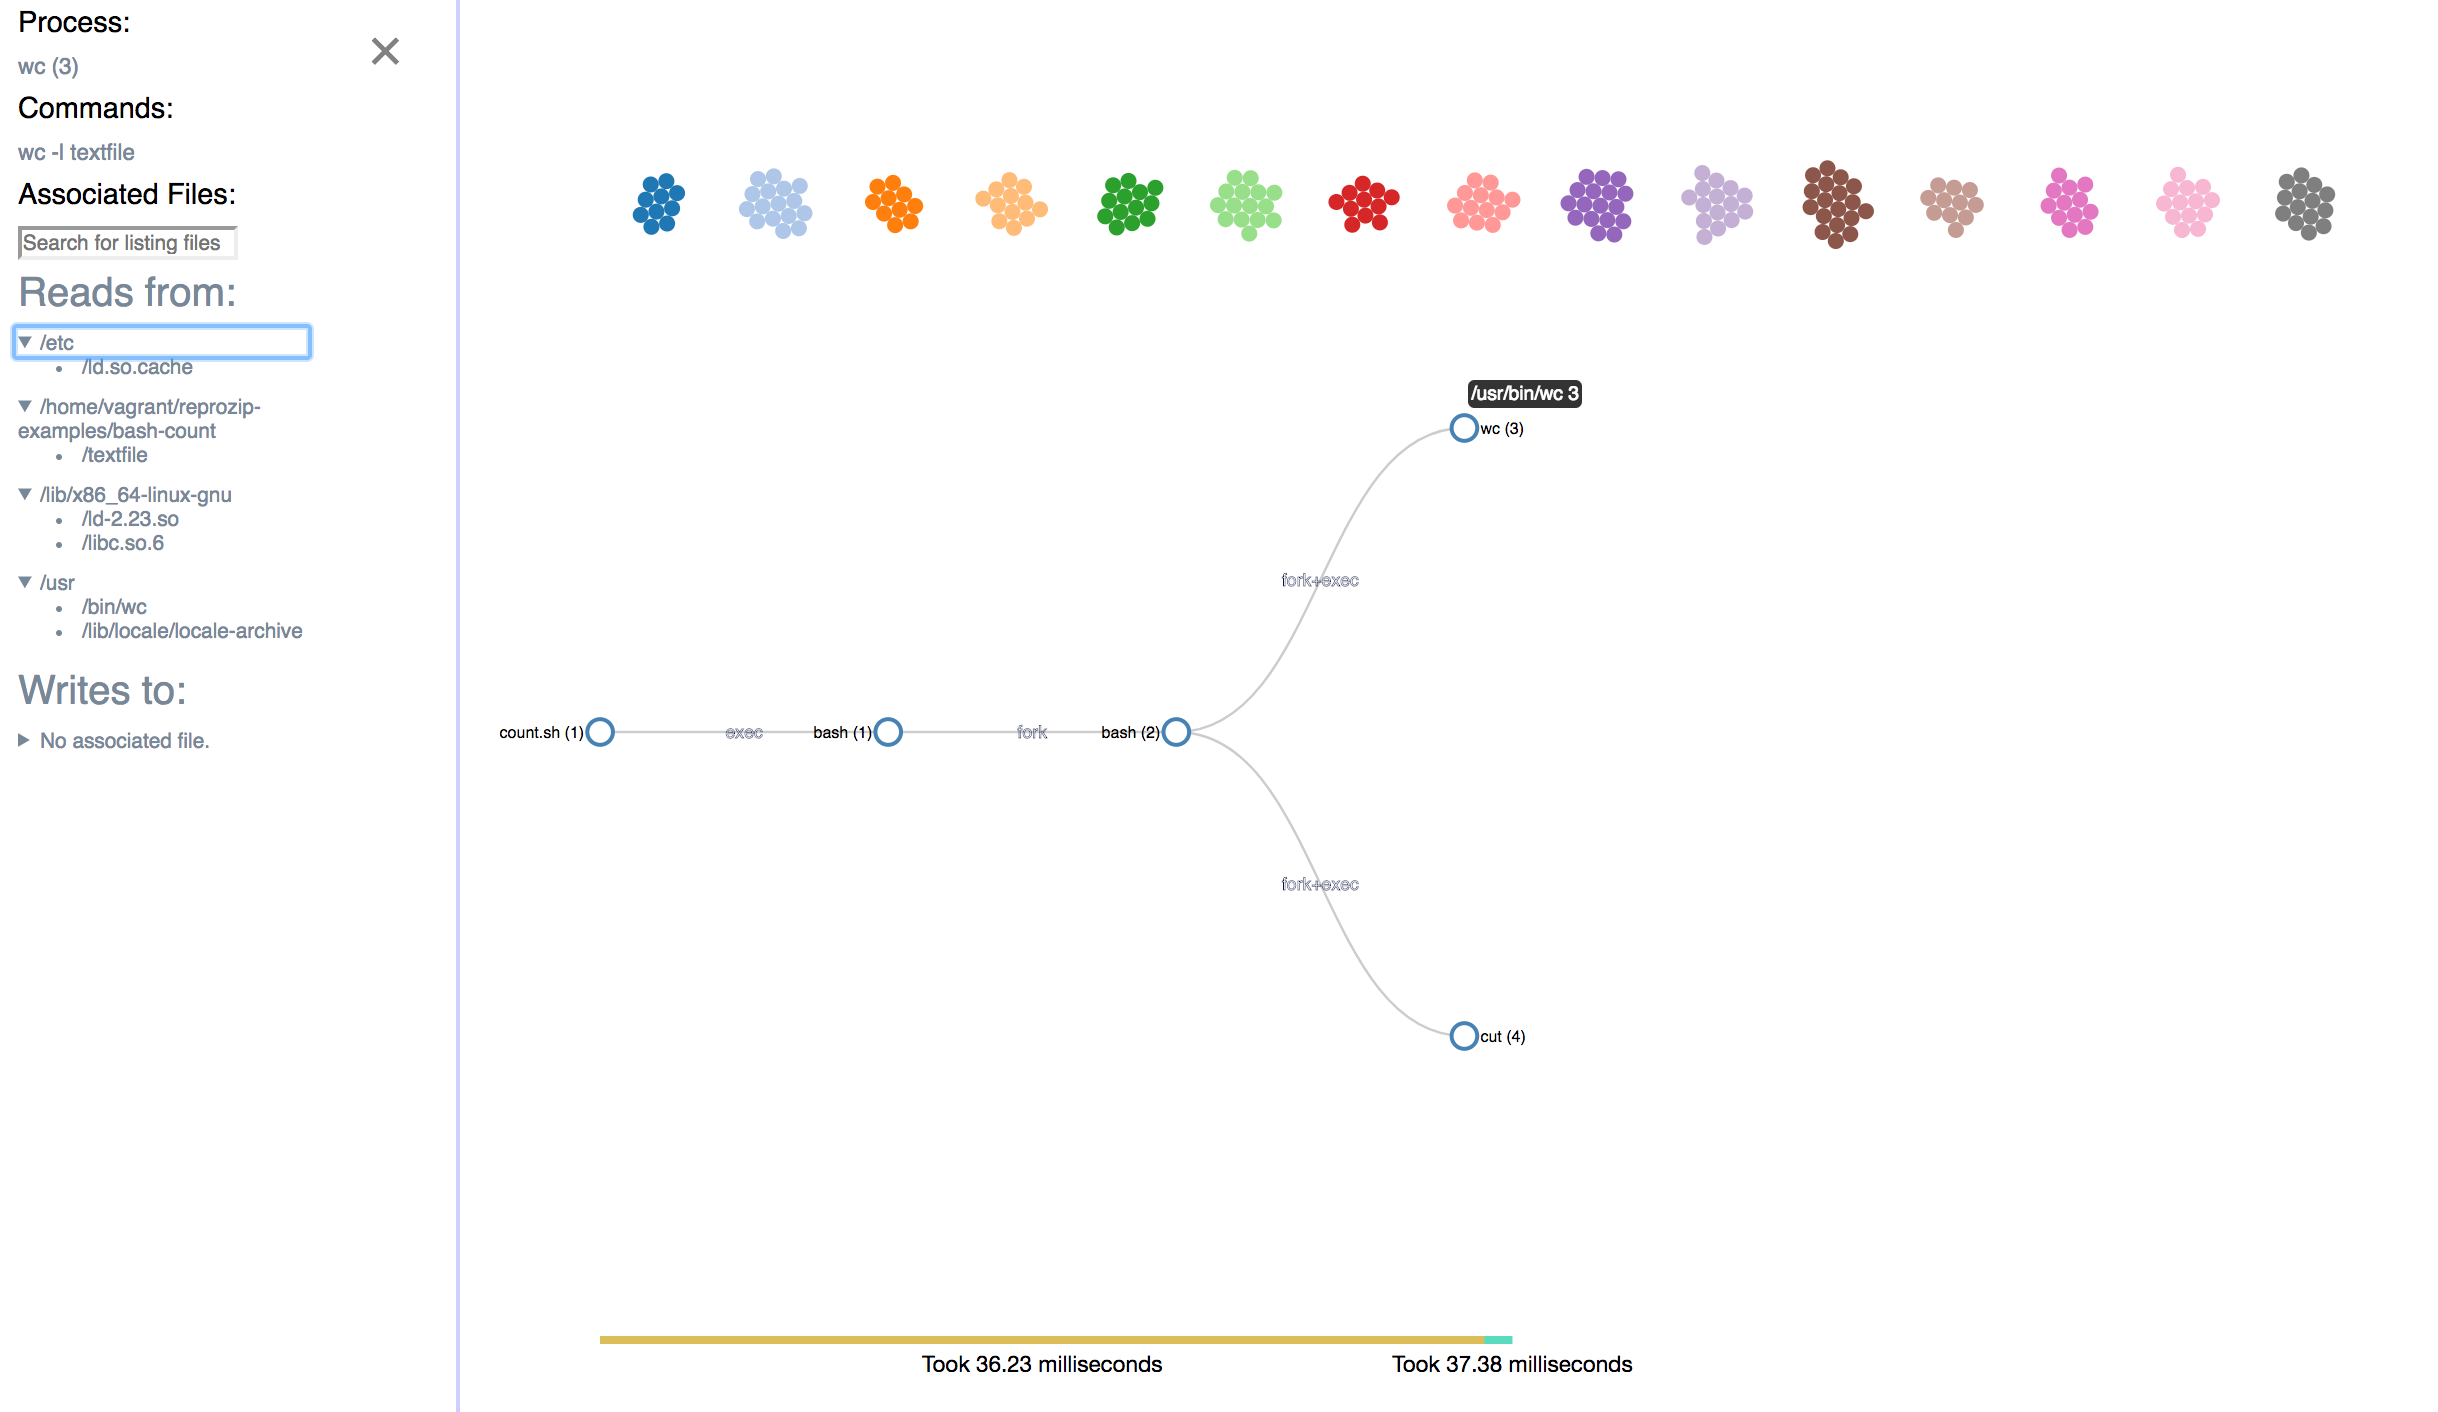
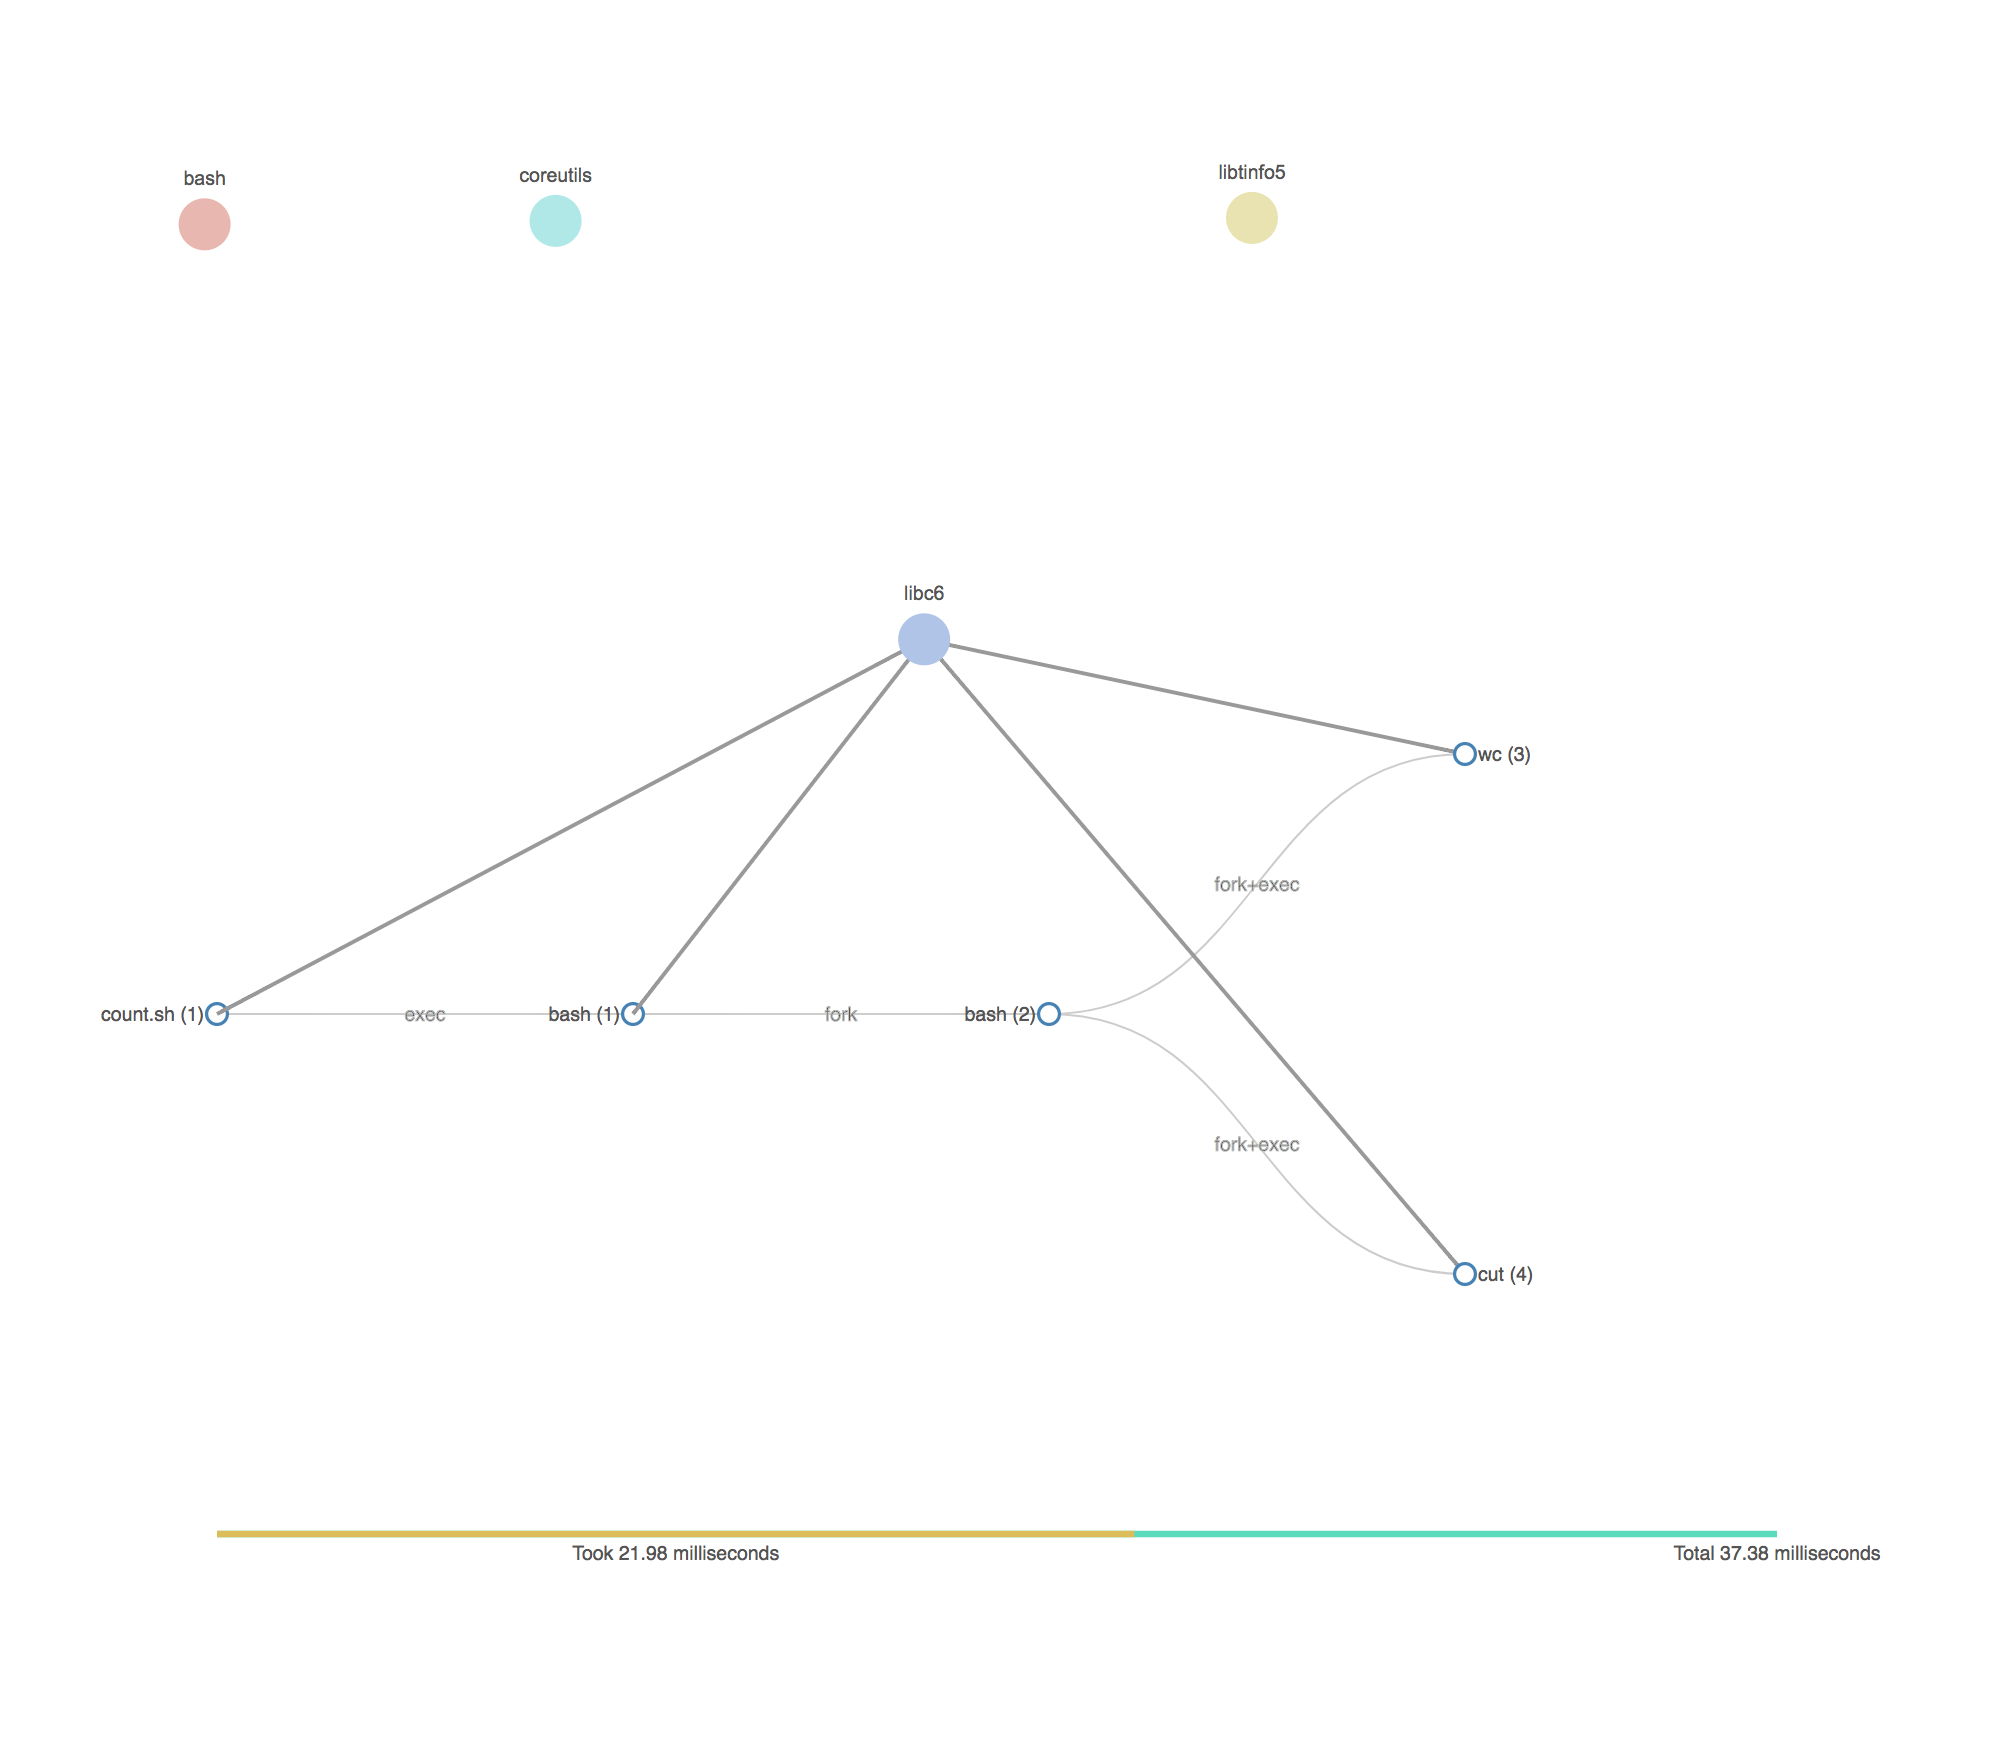
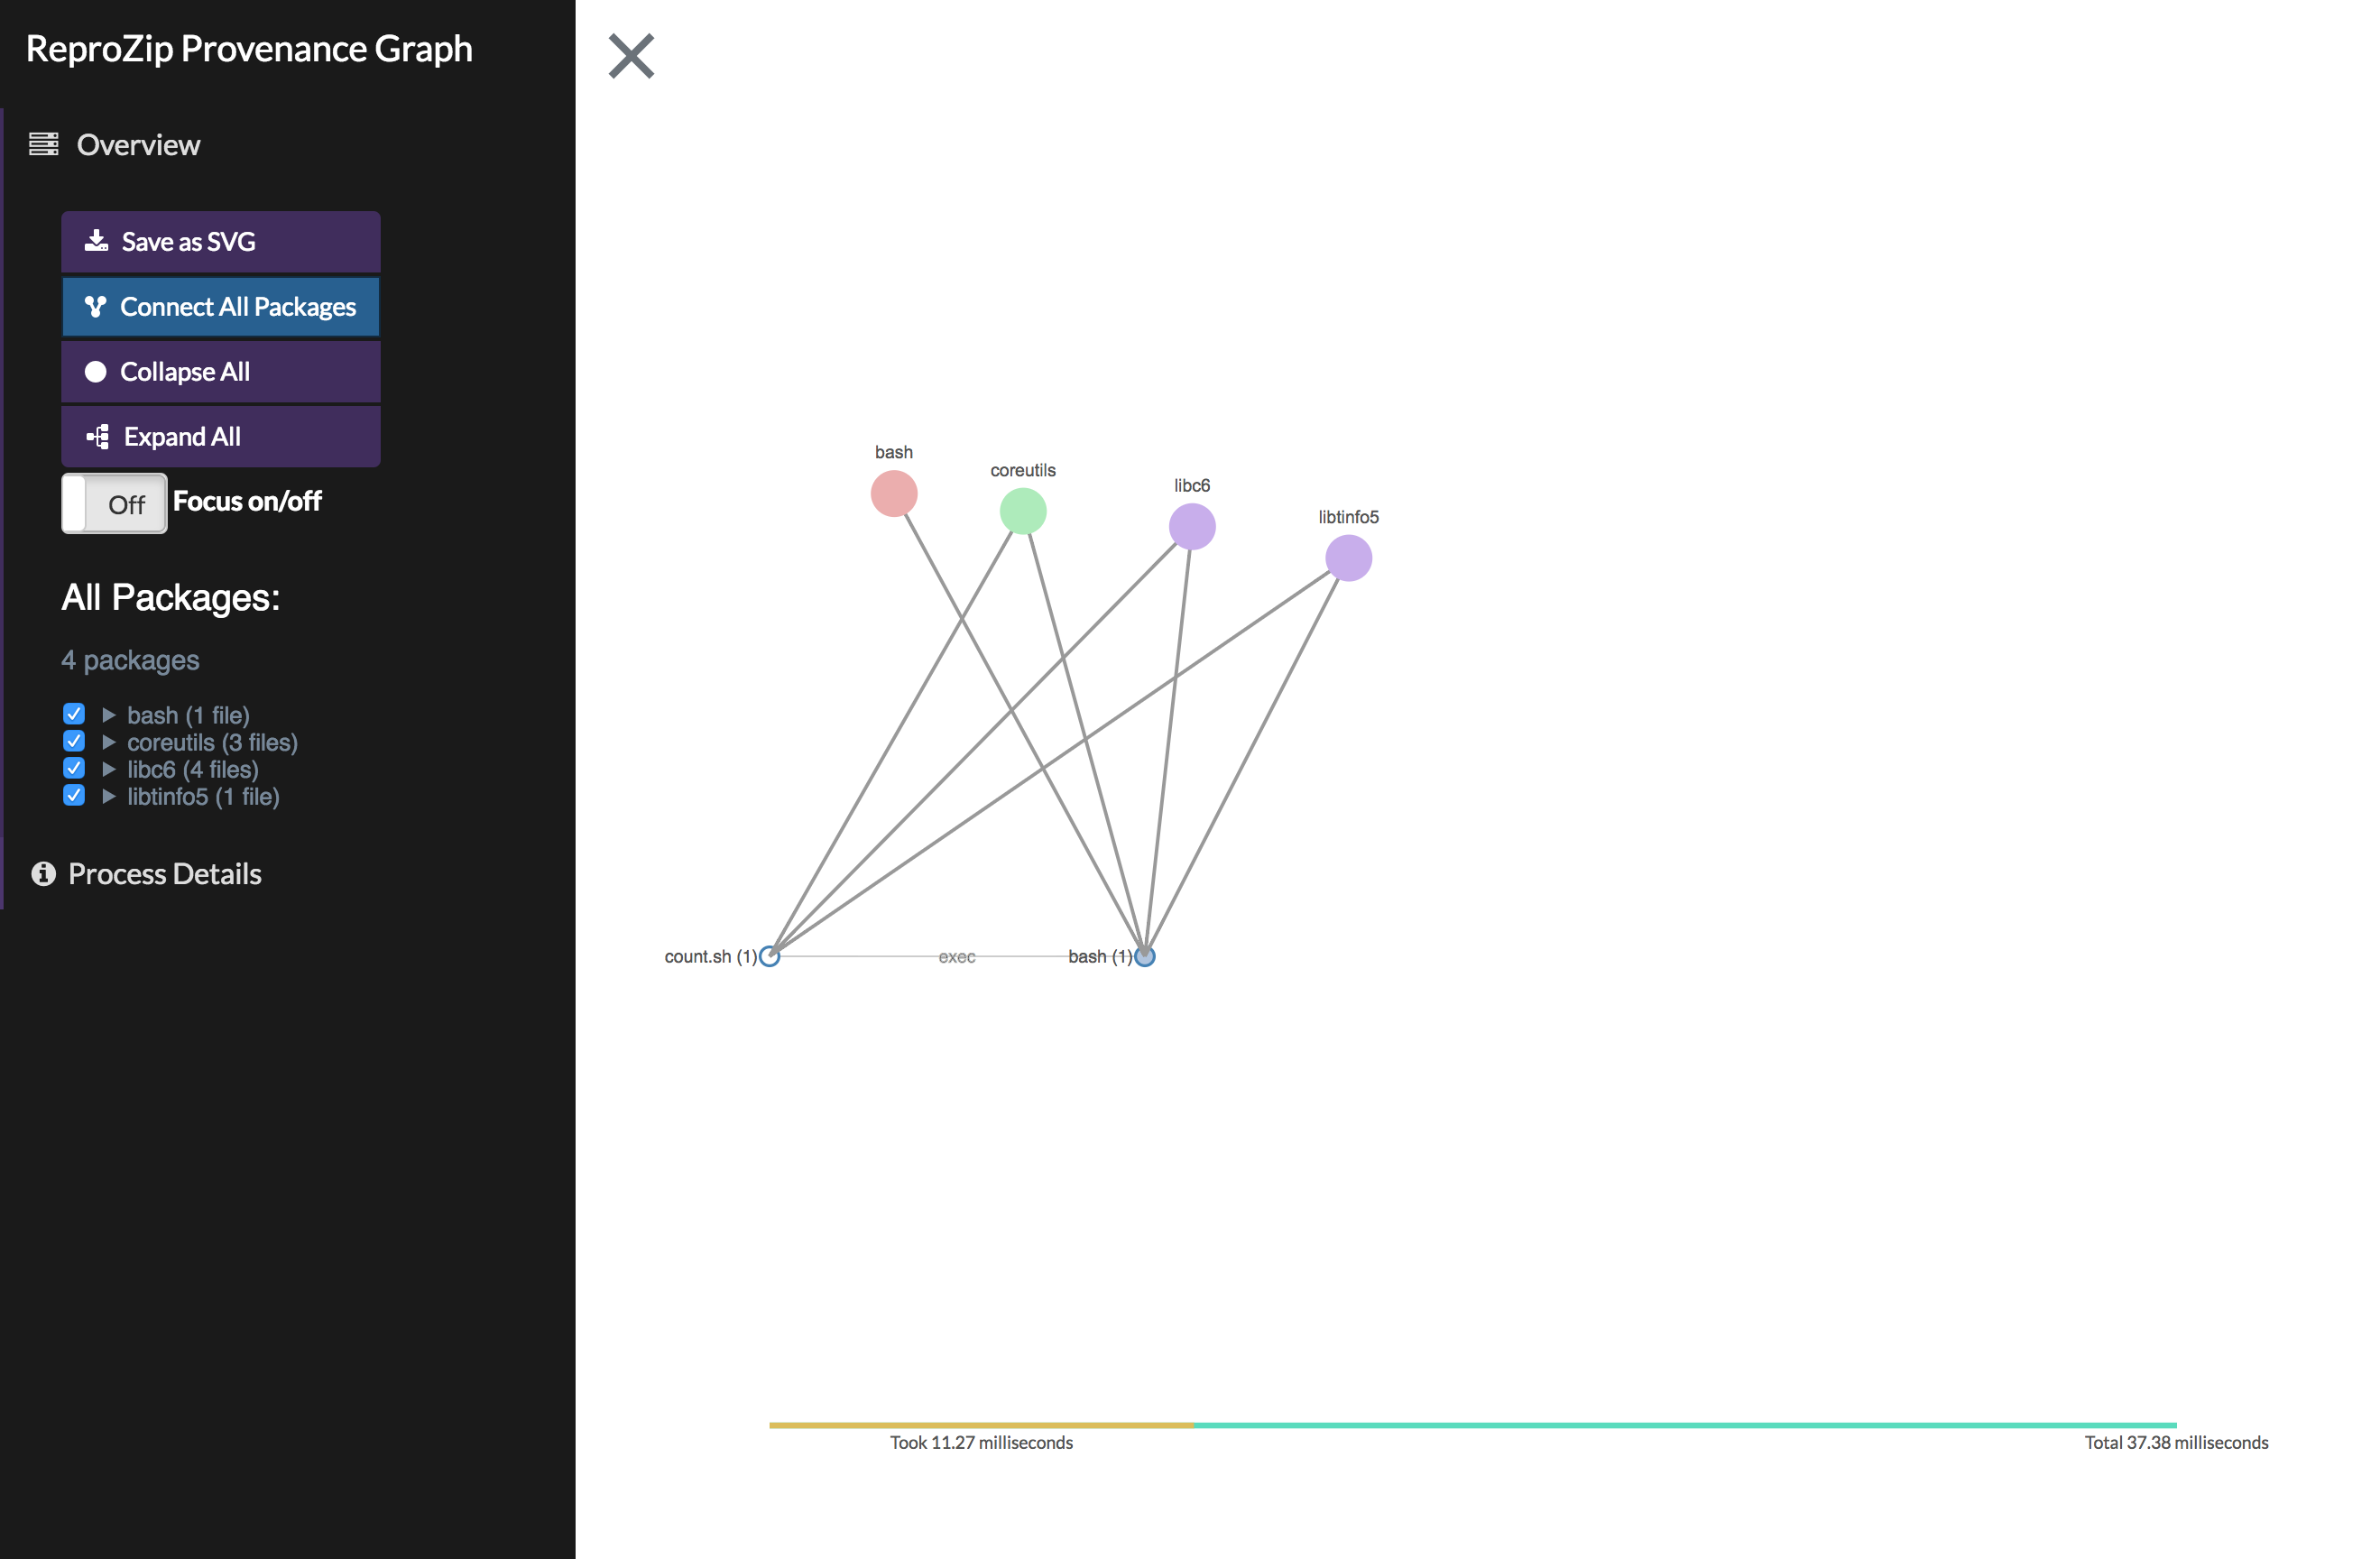
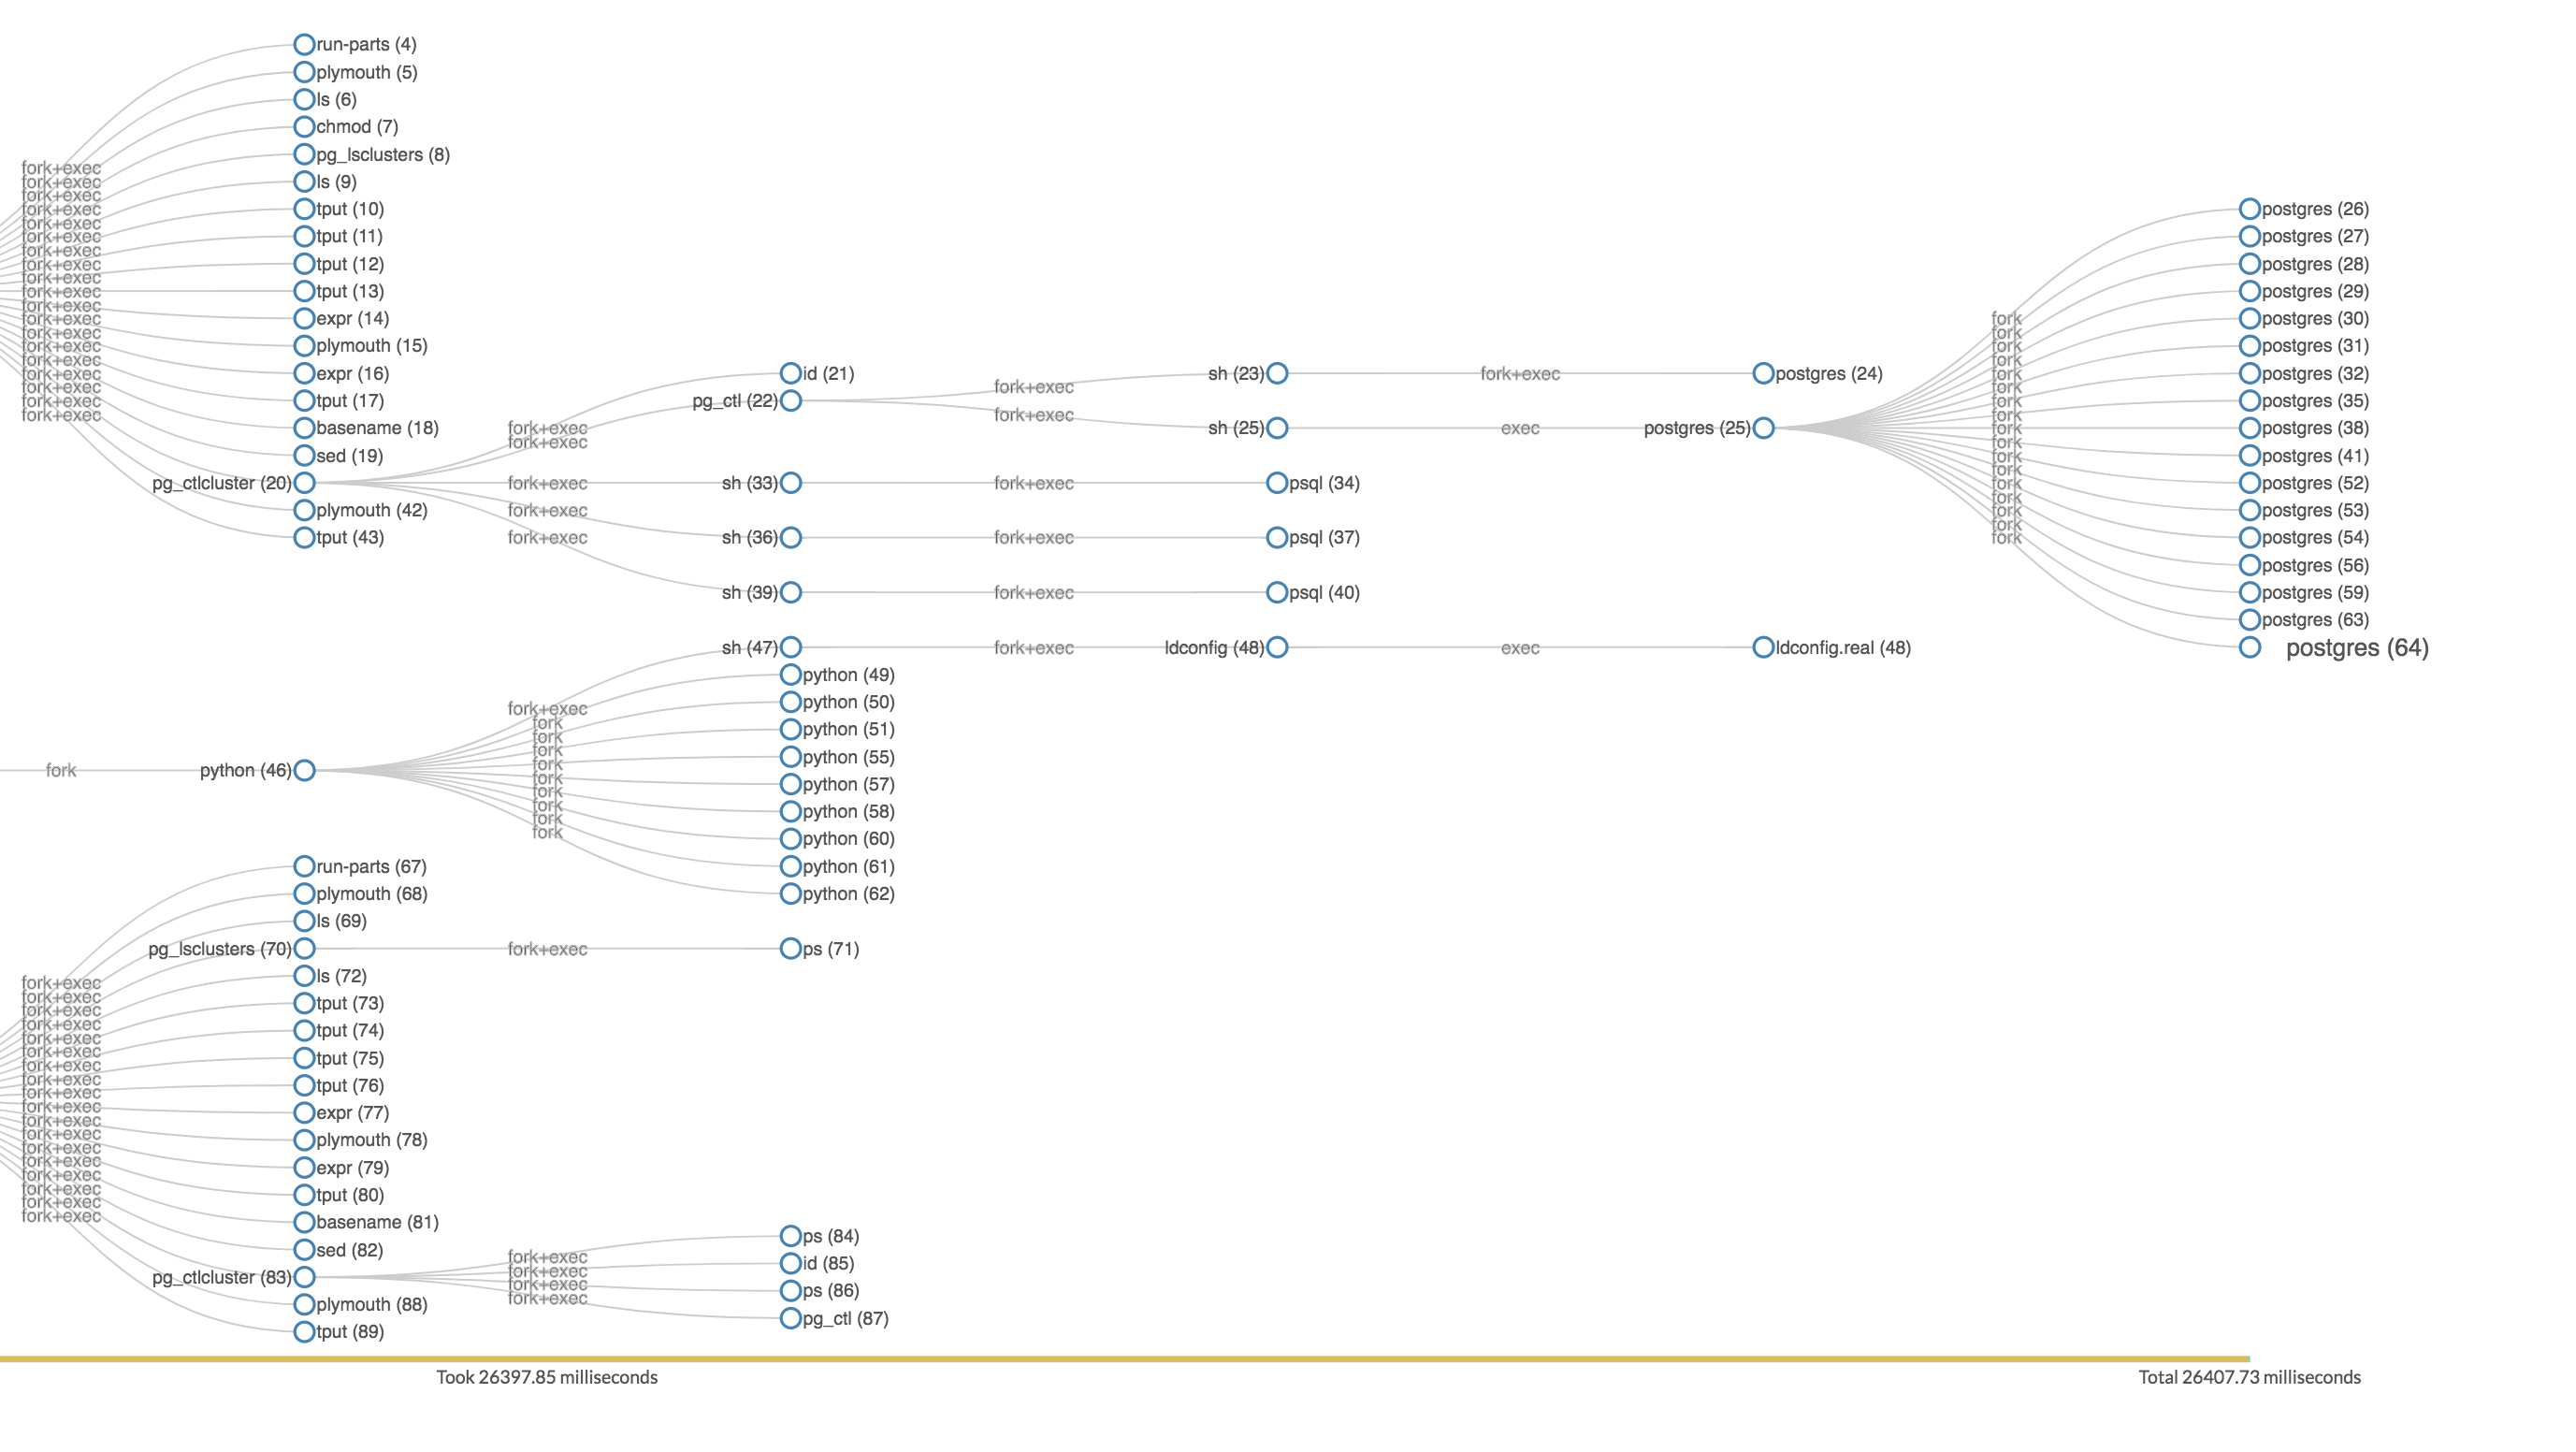
- Modified the timeline to show the total time and the duration for the current selected process.
- The length of duration of process on the timeline is now based on the ratio to the total time took for the entire experiment instead of the length of the expended process that show on the network graph.
- Got stuck on figuring out why a function was not executing from the expected order. It was due to "d3.json method is asynchronous, which means that after you call d3.json(), the code afterwards will execute first before the function inside the d3.json method has finished."
- The issue from above was fixed by the end of the day. And which helps to make the progress to fix a road block in the data structure for the visualization.
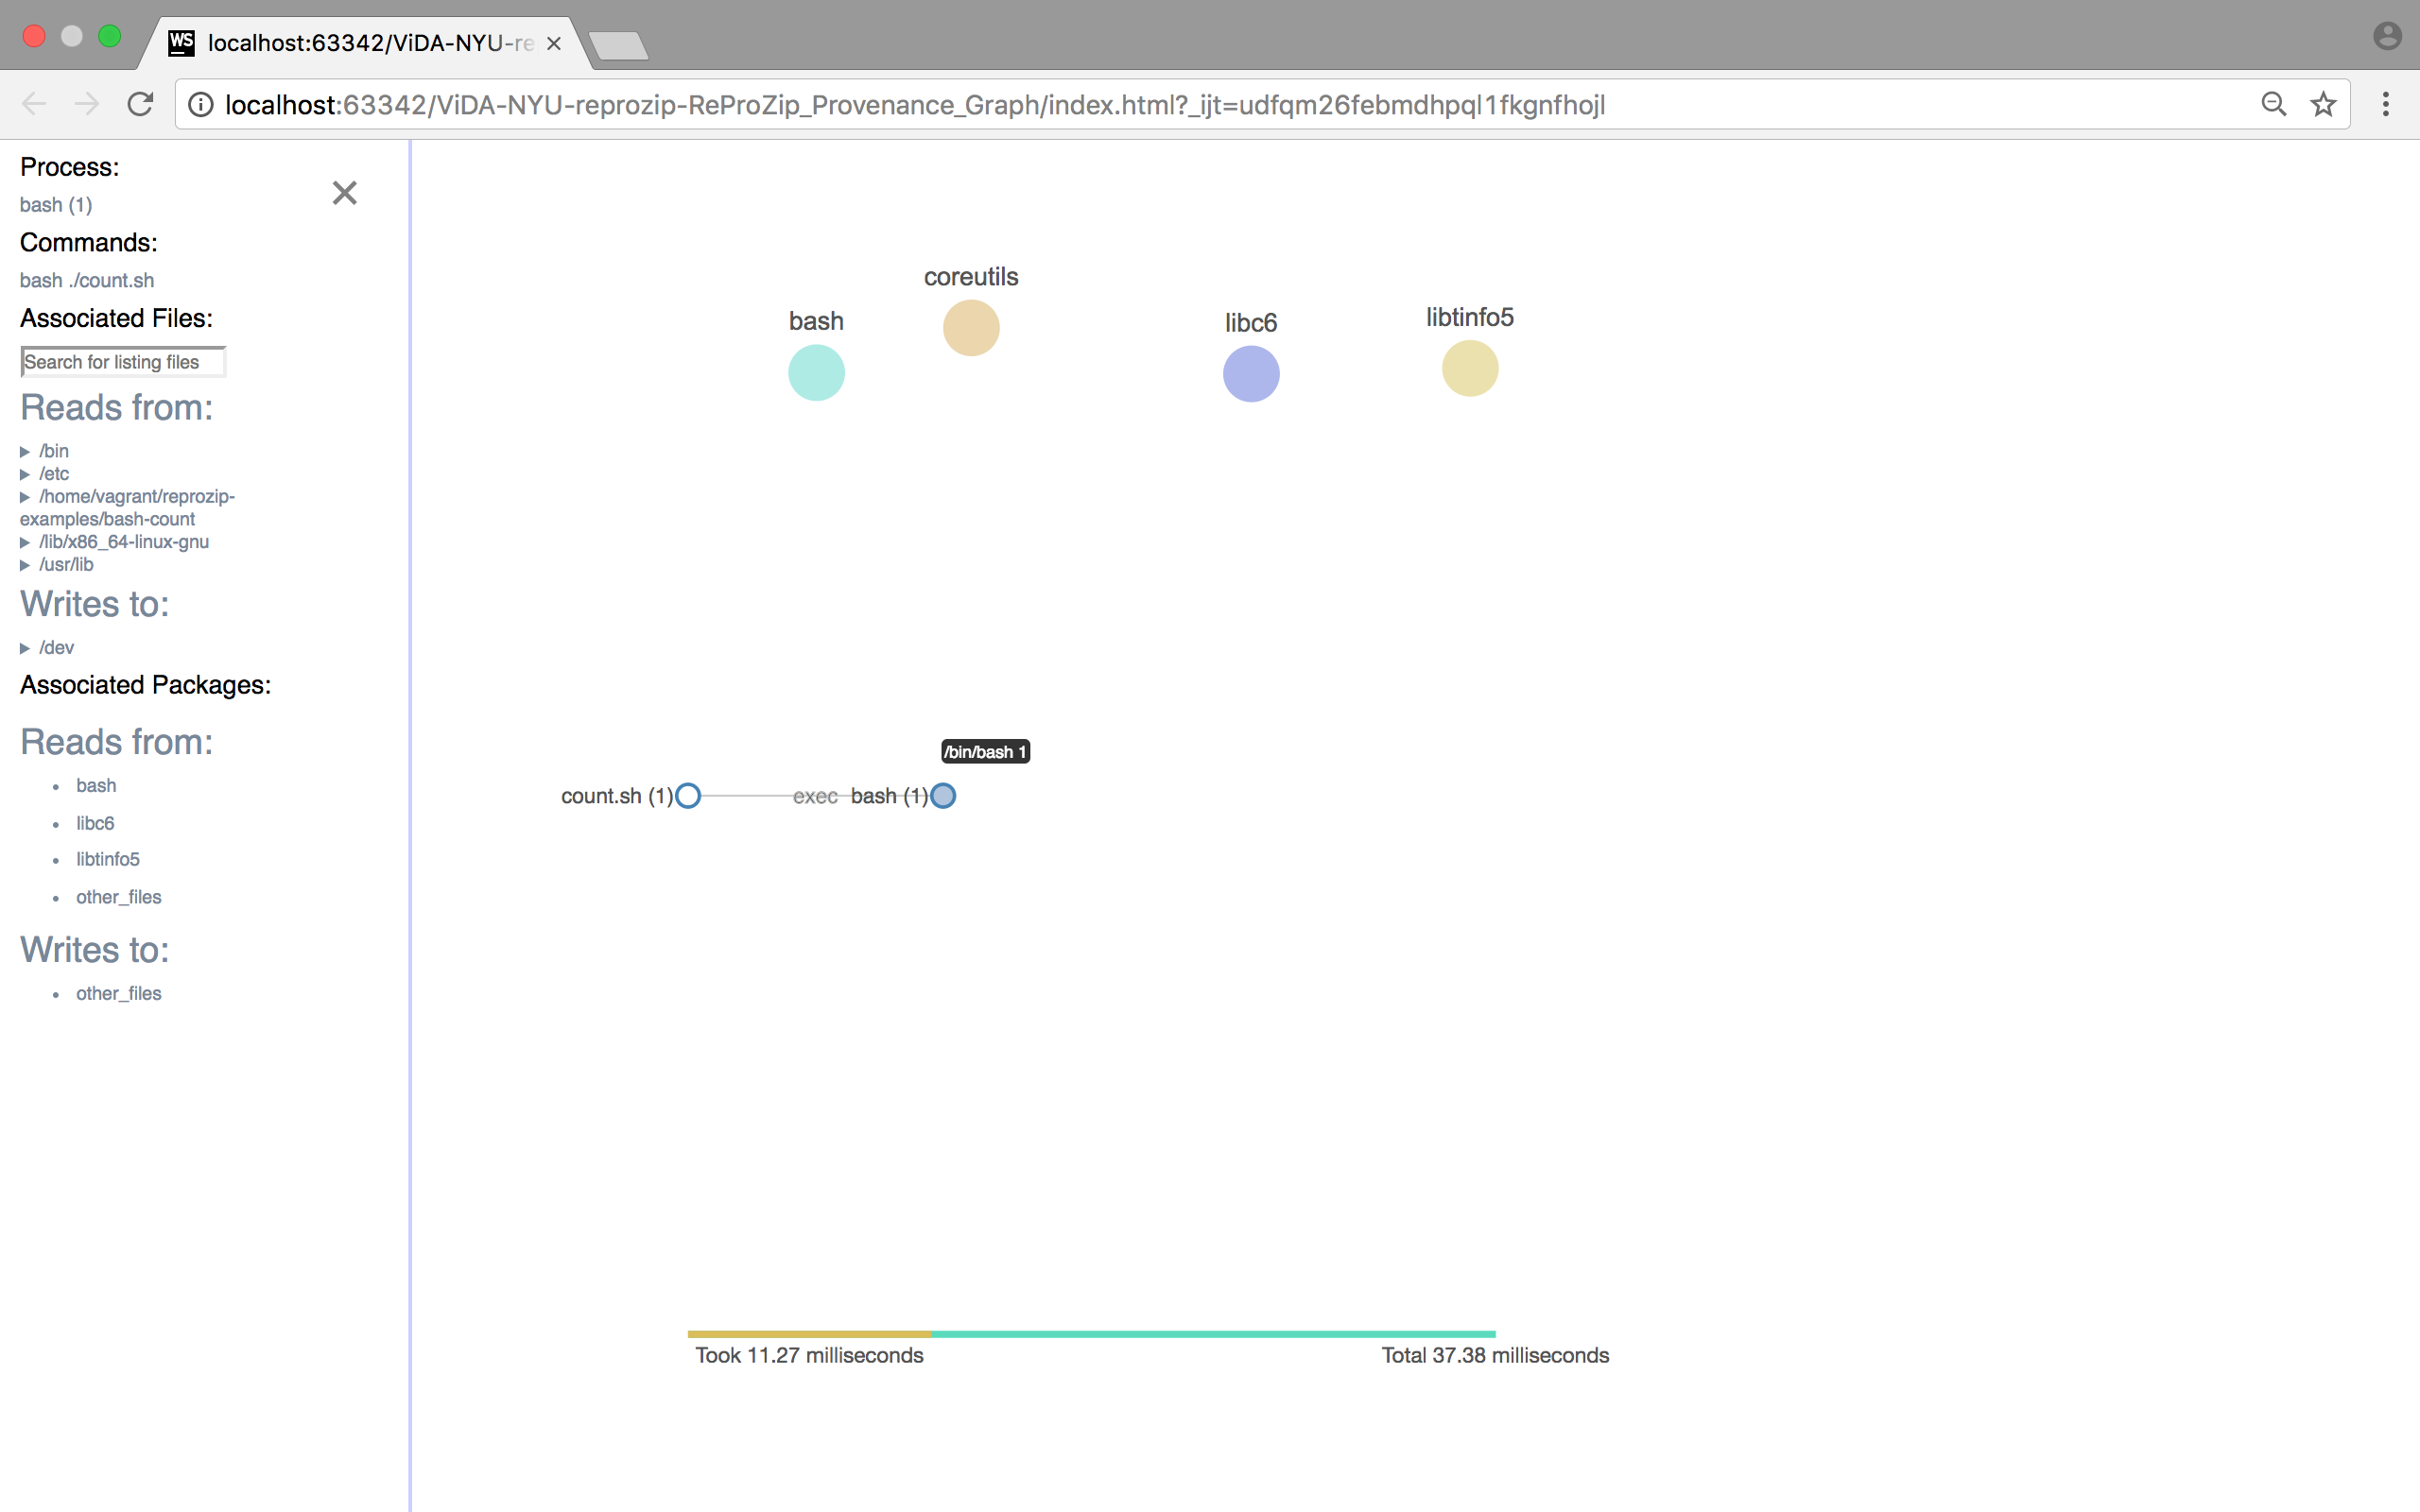
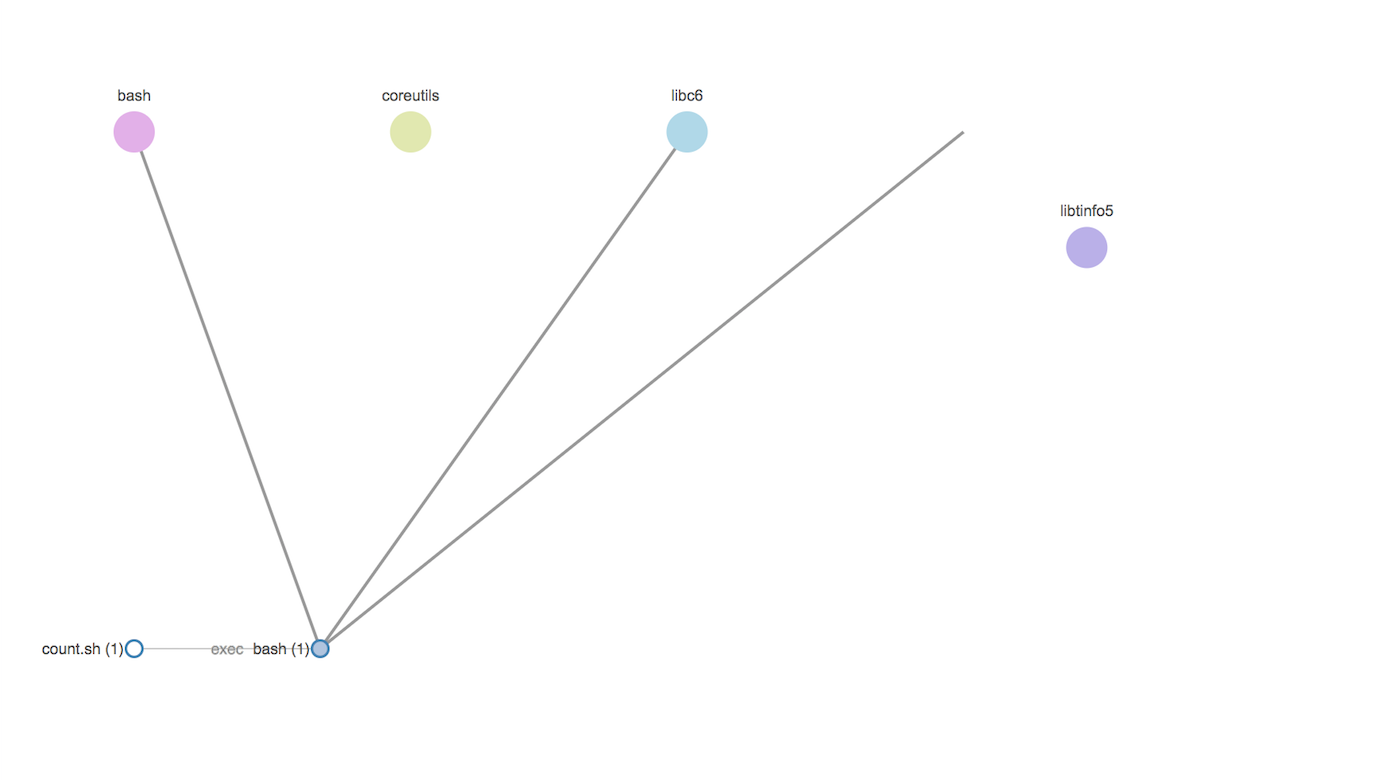
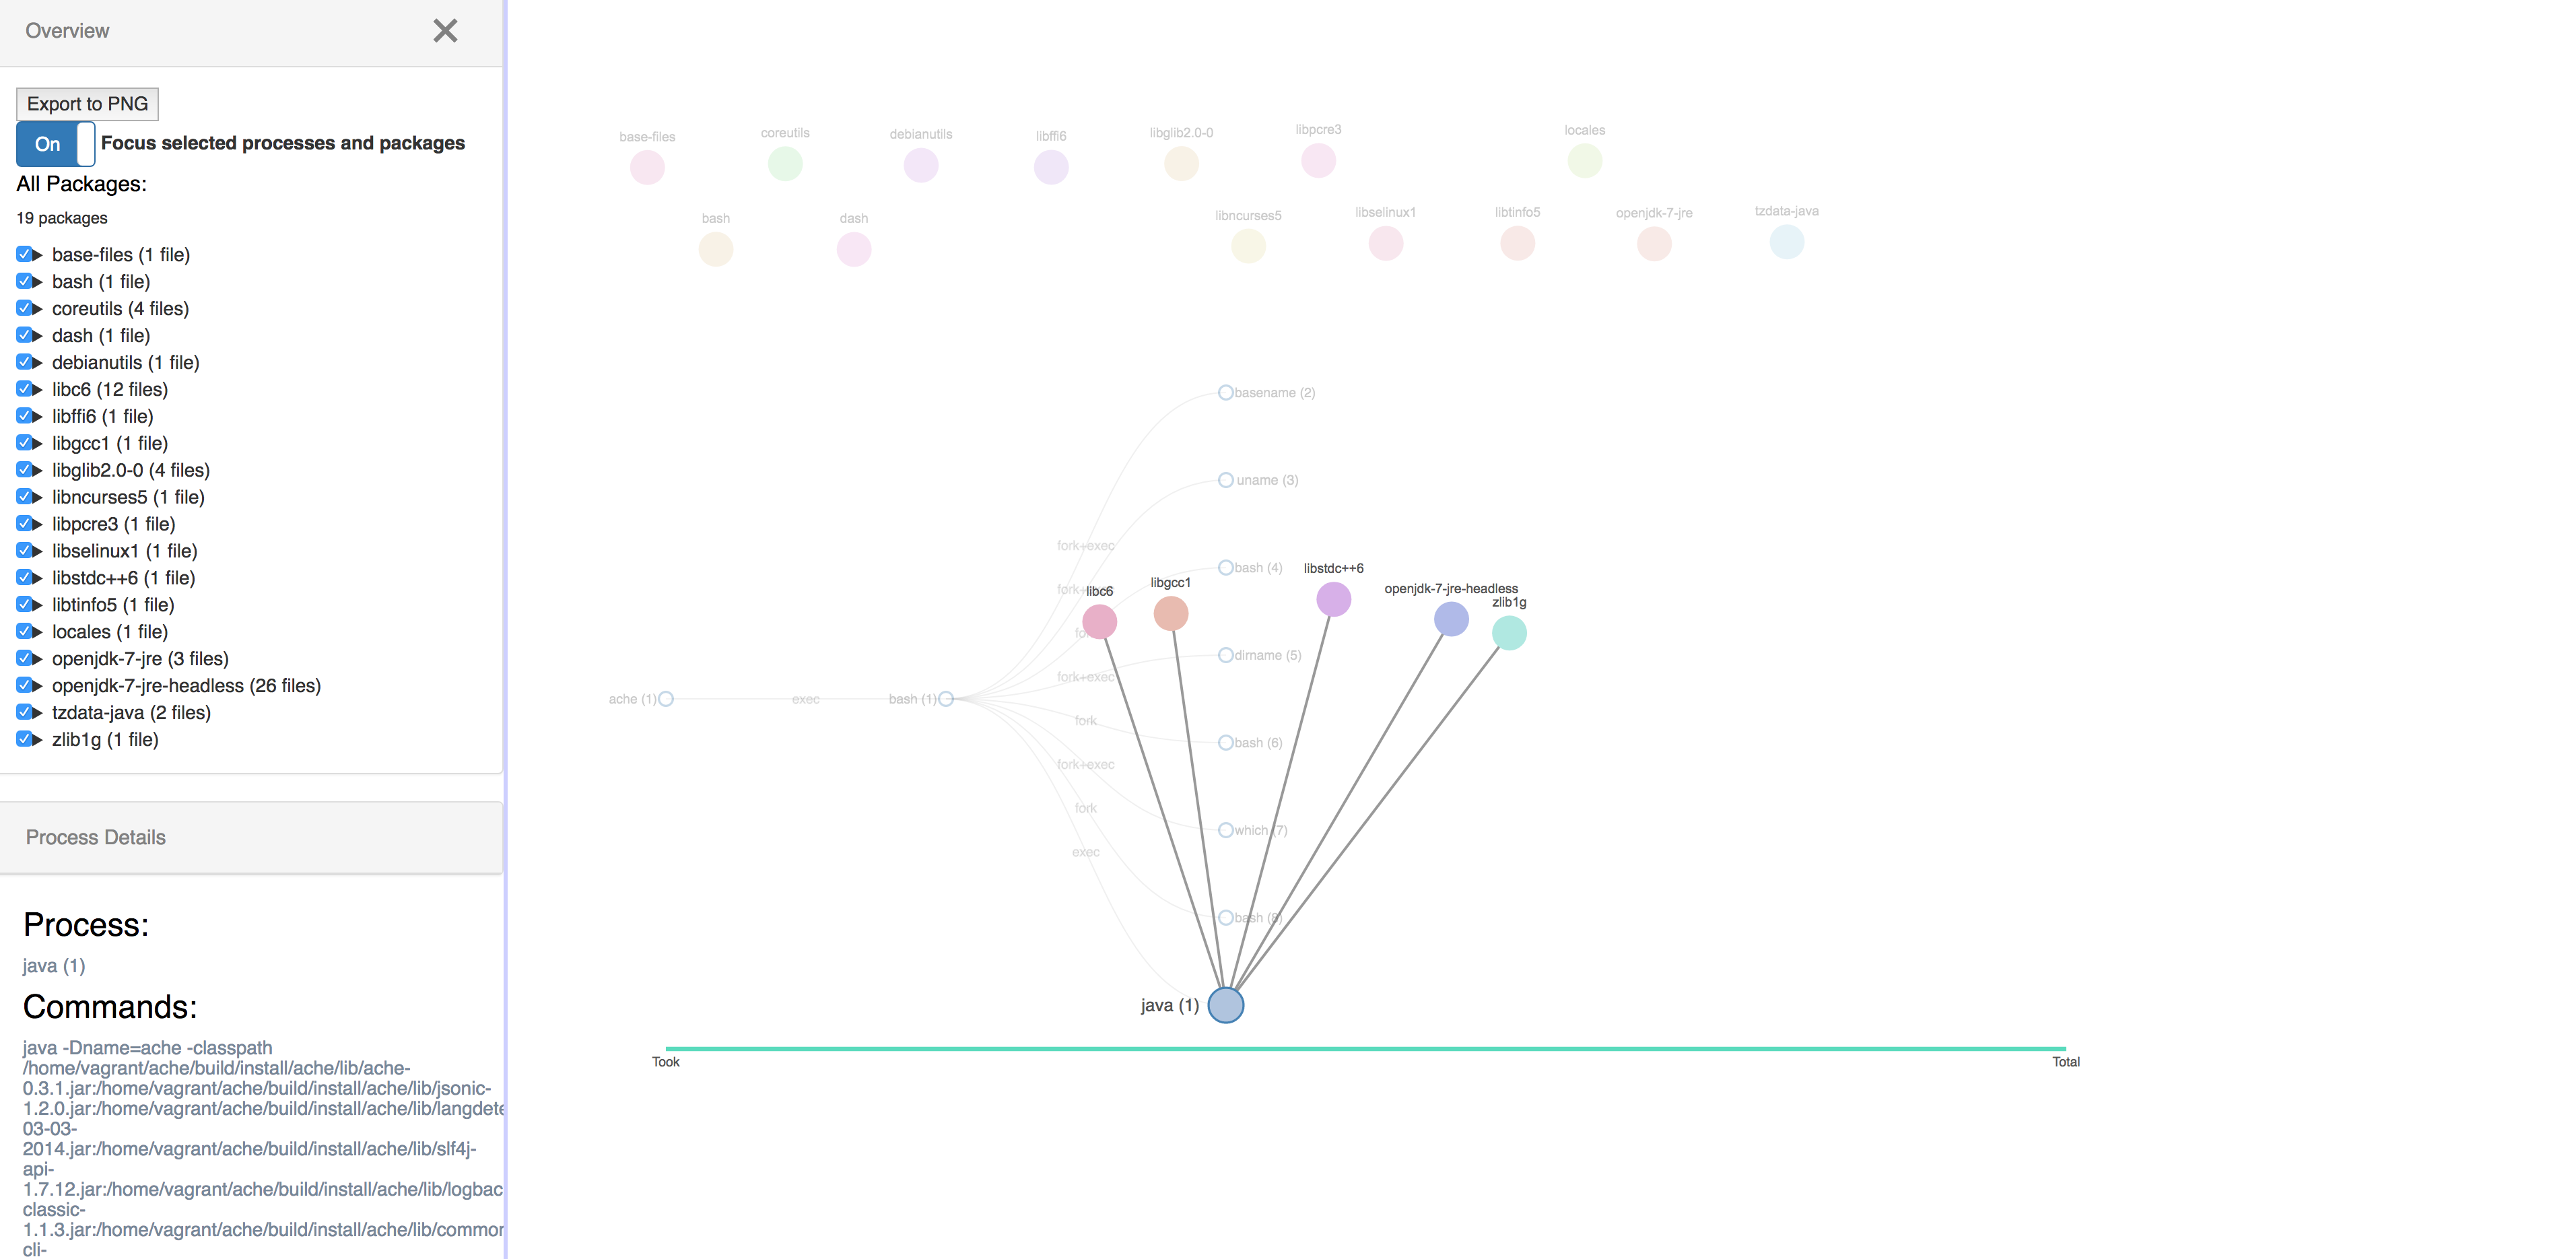
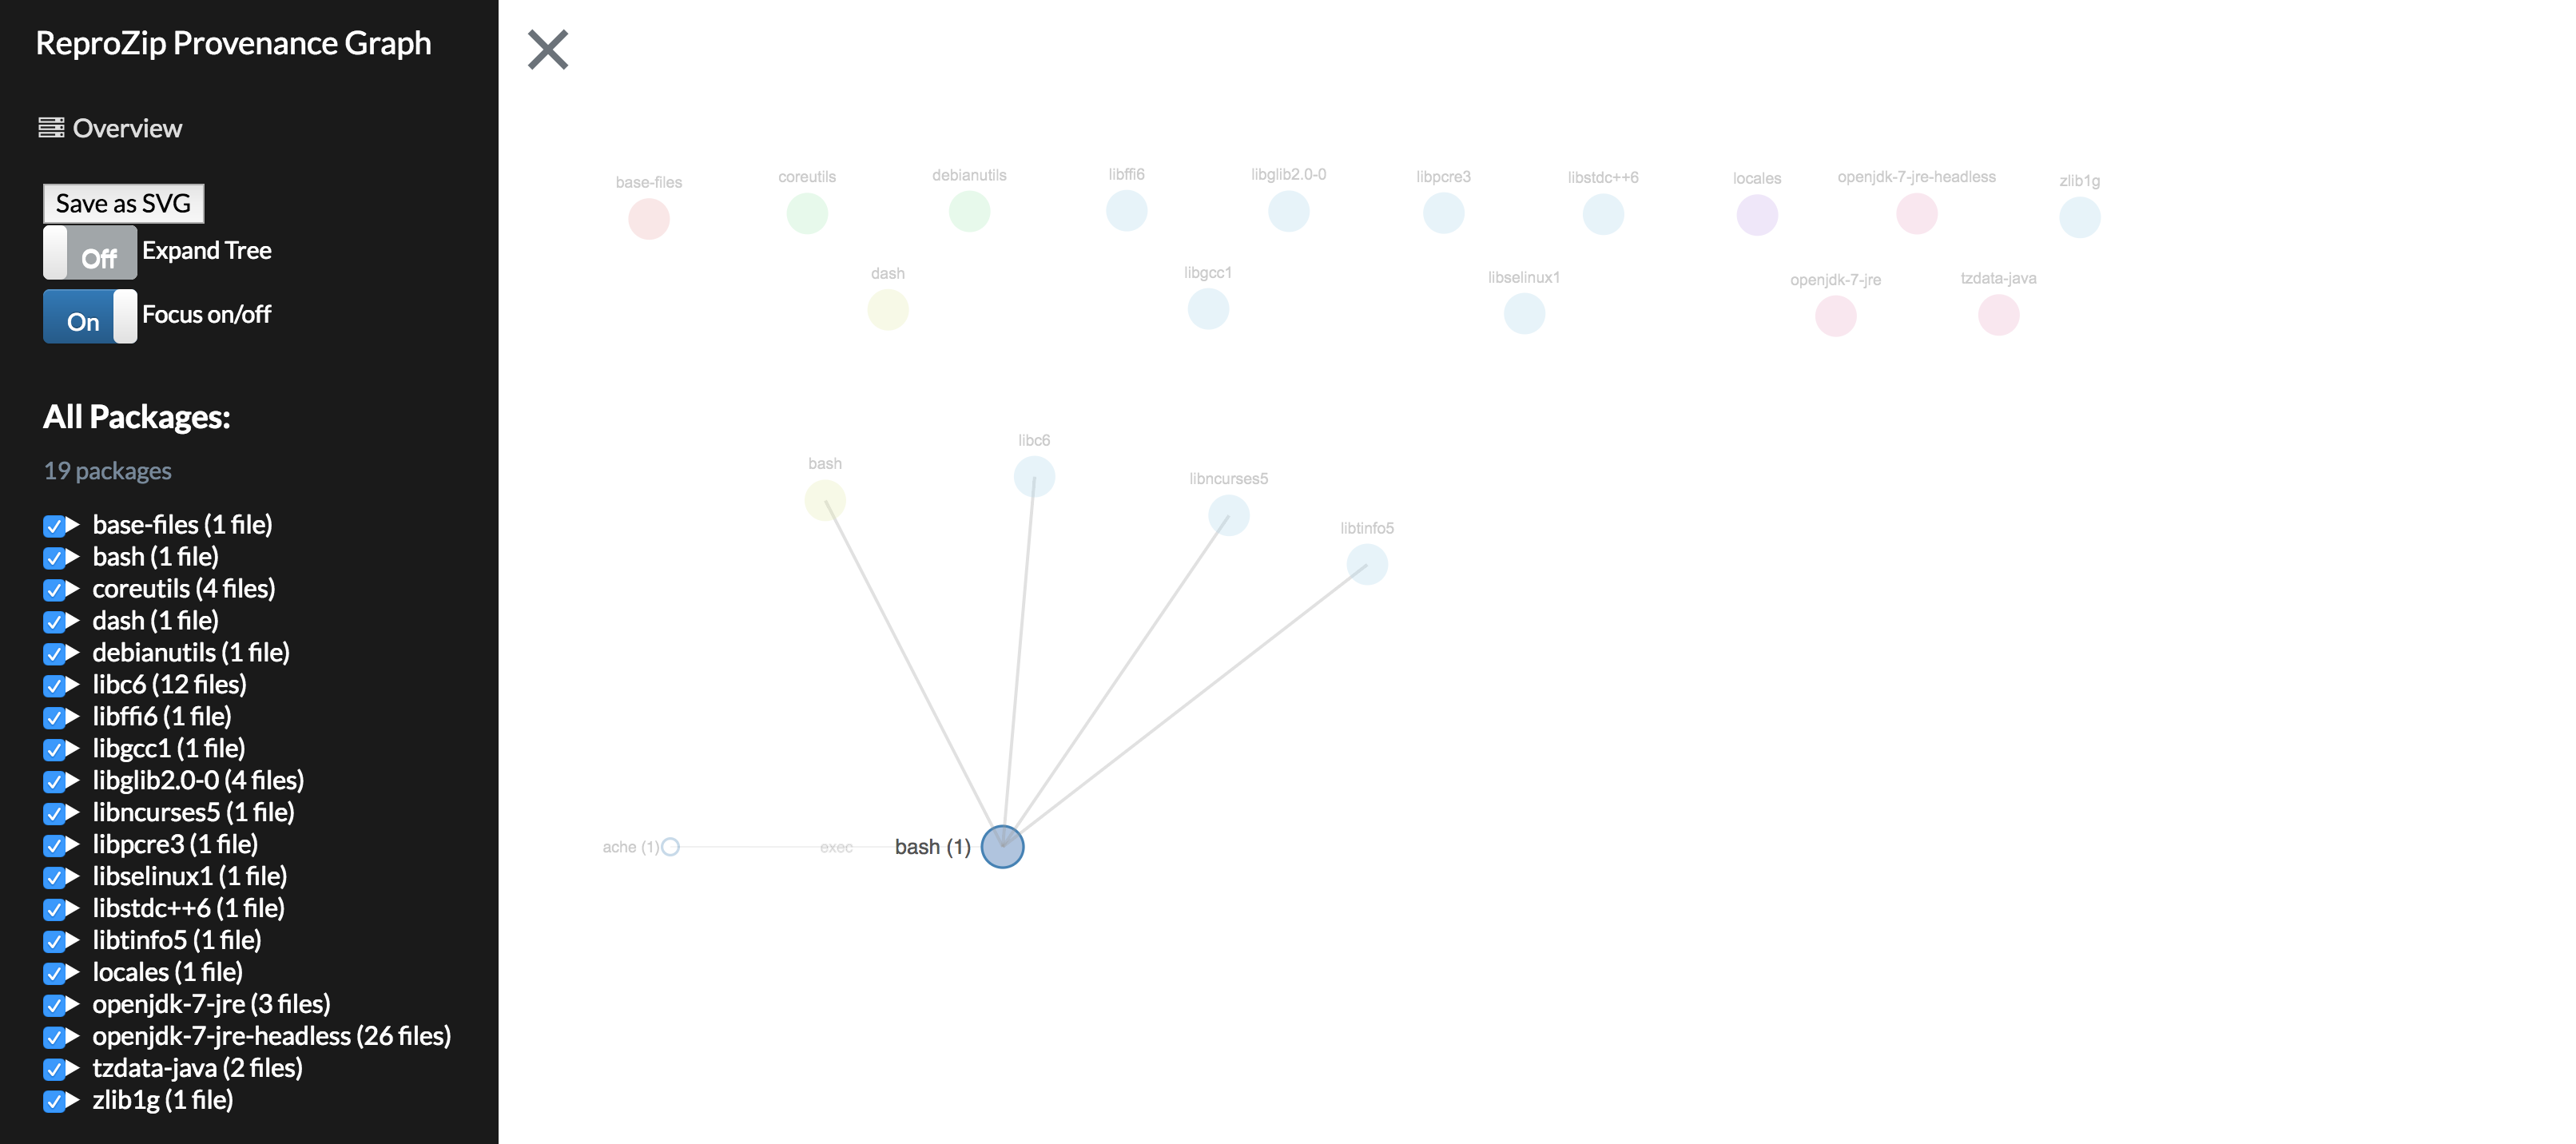
- Added "Associated Packages" in the sidebar when a process is selected
- Visualizing the packages and able to make the visulizing the connections between packages and processes.
- Trying to figure out why the links between connecting forces nodes were not displaying. Will continue to figure this out on Monday
- Morning: Tried to visualize the links to connected the packages to the process. But the position is still a bit off not able to drag the package around yet.
- Afternoon: Set up the back-end environment for the dictionary of files
- Morning: Completed the updates for the sidebar to include list of packages and files within.
- Afternoon: Still tried to connect the links to force nodes
- Morning: Continue to work on connection the links
- Afternoon: Enhance the side bar's search function and automatically adjust the visualization's width when open or close the sidebar
- Refactoring the code and had code review with Remi
July 10th - July 14th
- Able to link packages with associated processes and display the links. But when move the packages, the links did not follow
- Finally, wired the packages with the processes. When moving the packages, the links that connected to the process will move alongside.
July 17th - July 21st
- Tried to put packages on the right hand side. But the result was not looking as expected
- Keep packages on the top and added an margin on top so the network graph will not cross over to the packages.
- Researching on how to make large scope changes via user interaction (ex. check boxes). Researched on using react js, jQuery and bootstrap
- Managed to accomplish "check boxes for specific packages to show/hide" alongside with all the neccessary setups
-
Morning: Completed the updates for the sidebar to include list of packages and files within.
-
Afternoon: Still tried to connect the links to force nodes
- Evaluate the value and effort to build between "When a parent process is selected, show pkgs used by children" and "show all associated process from selected package"
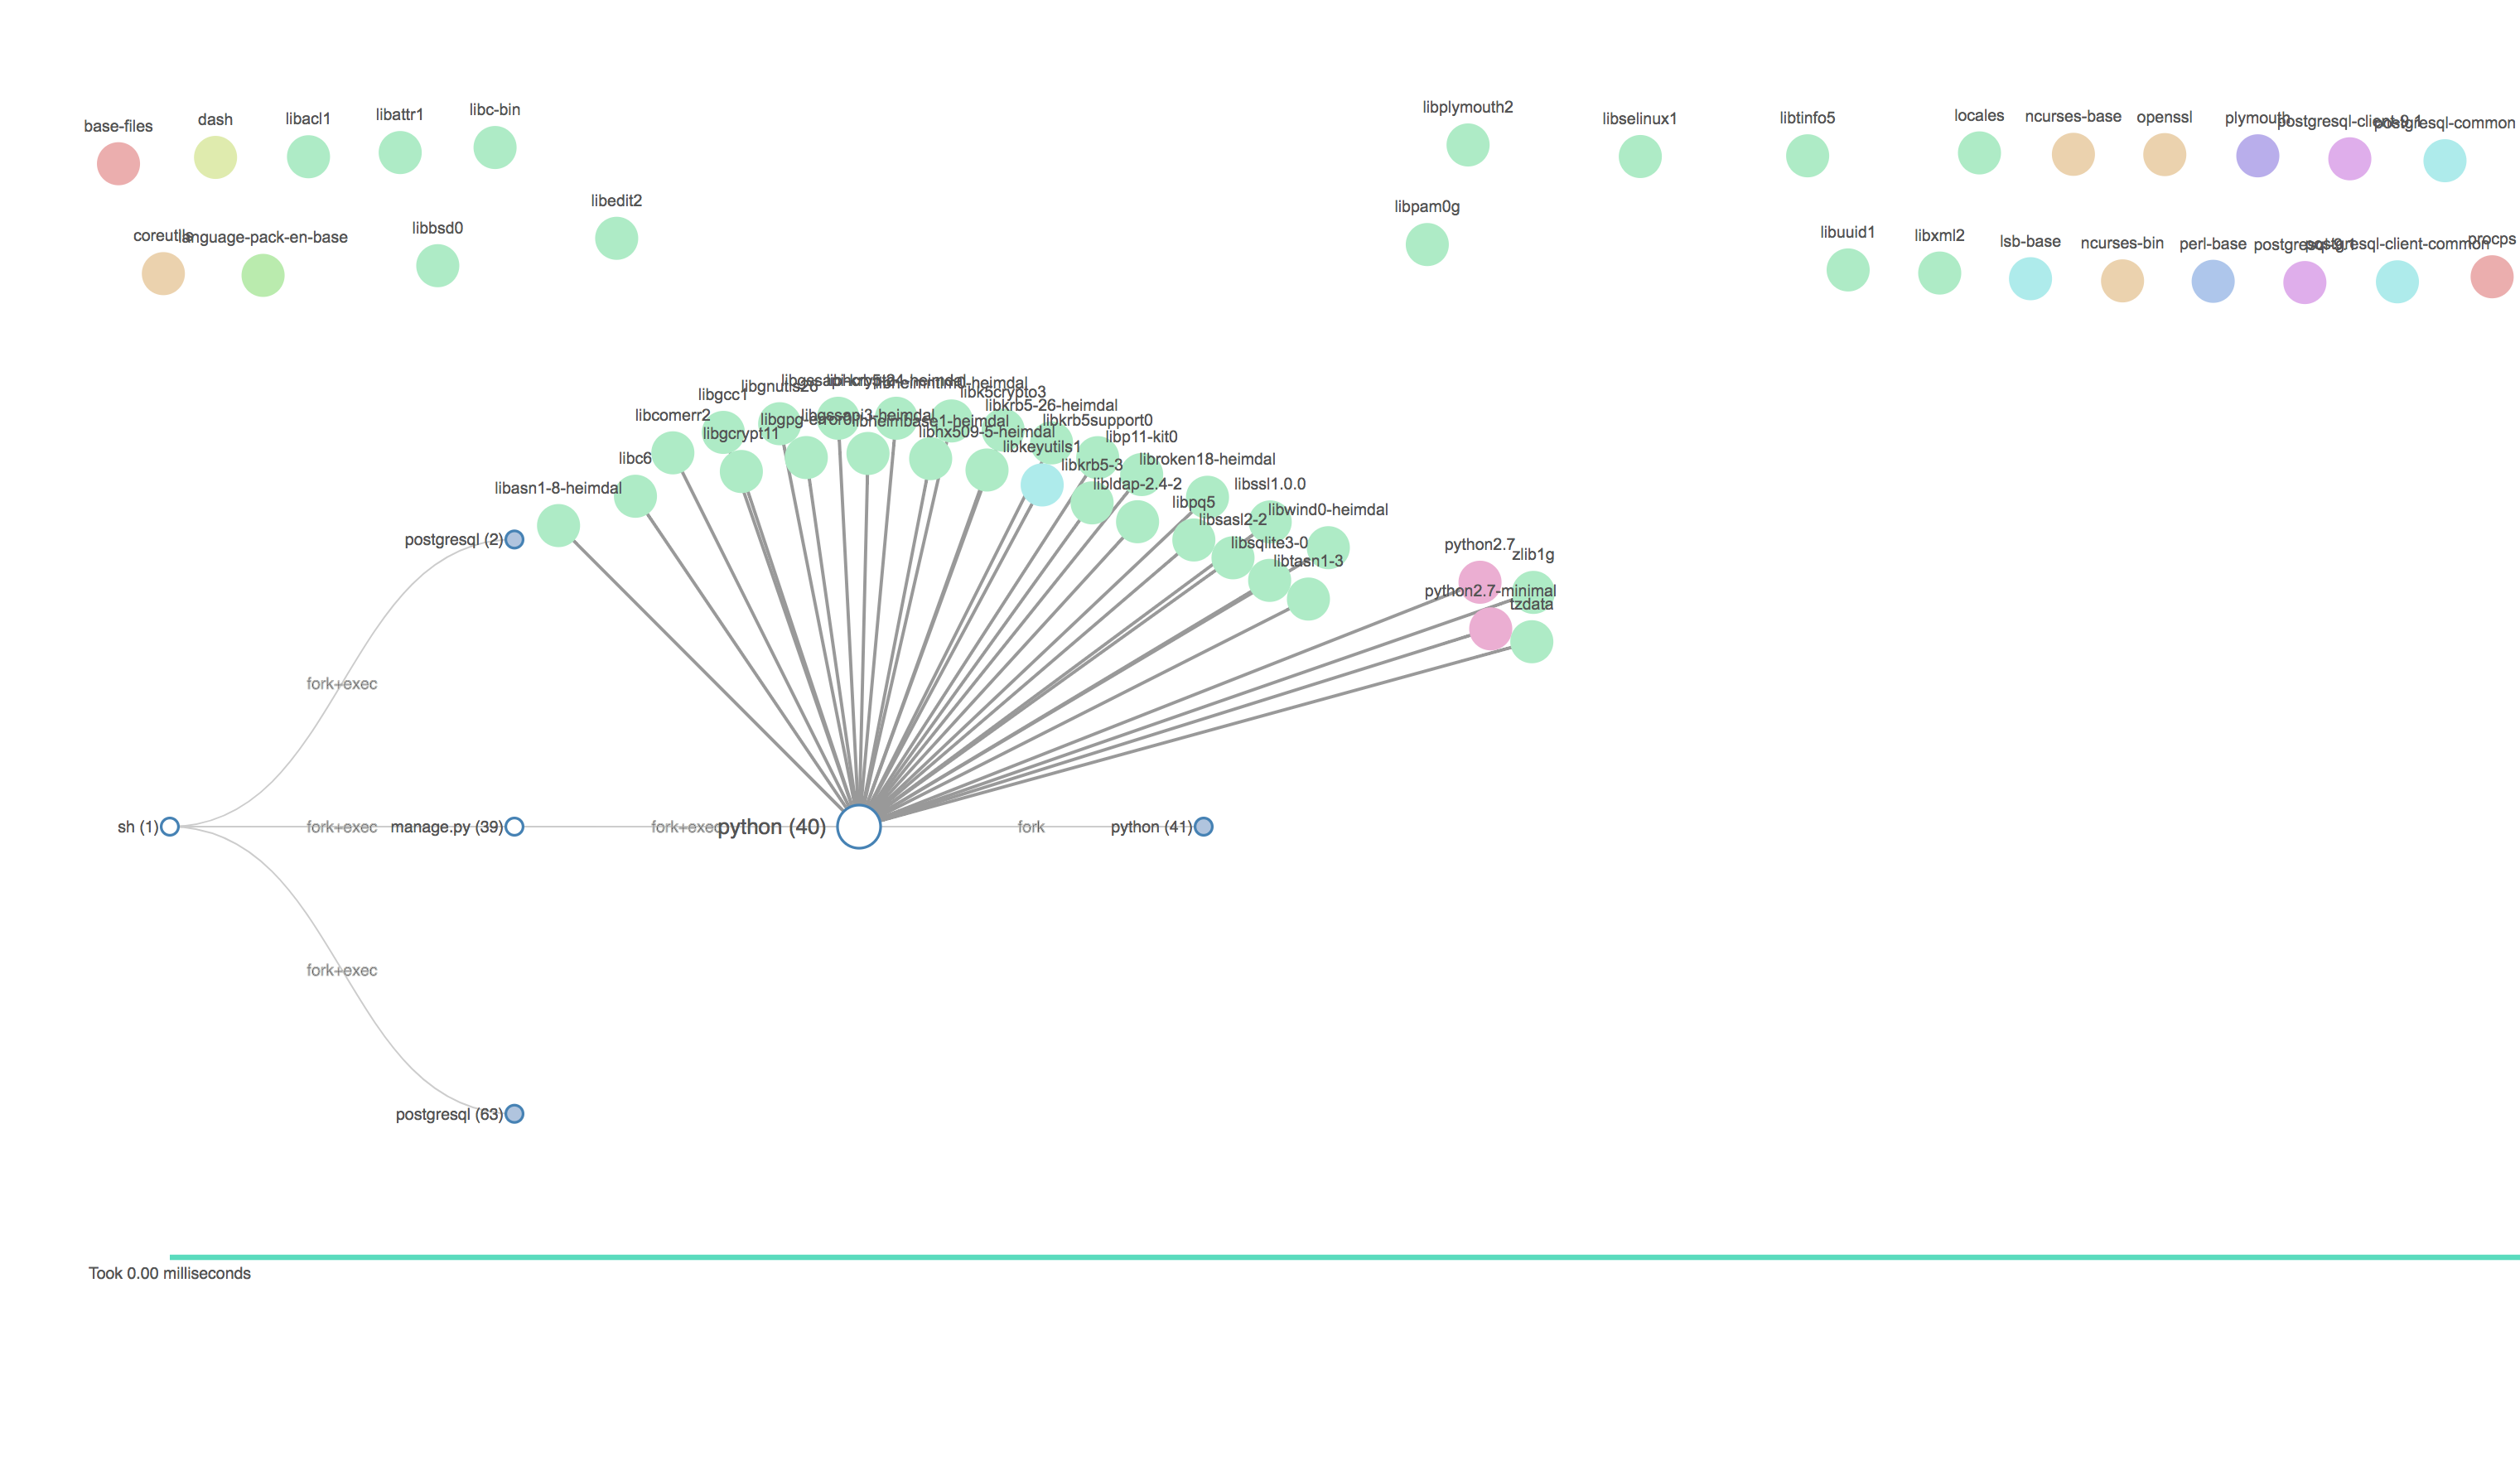
- Build up the back-end structure to connect all associated process from selected package and attempted to visualize it.
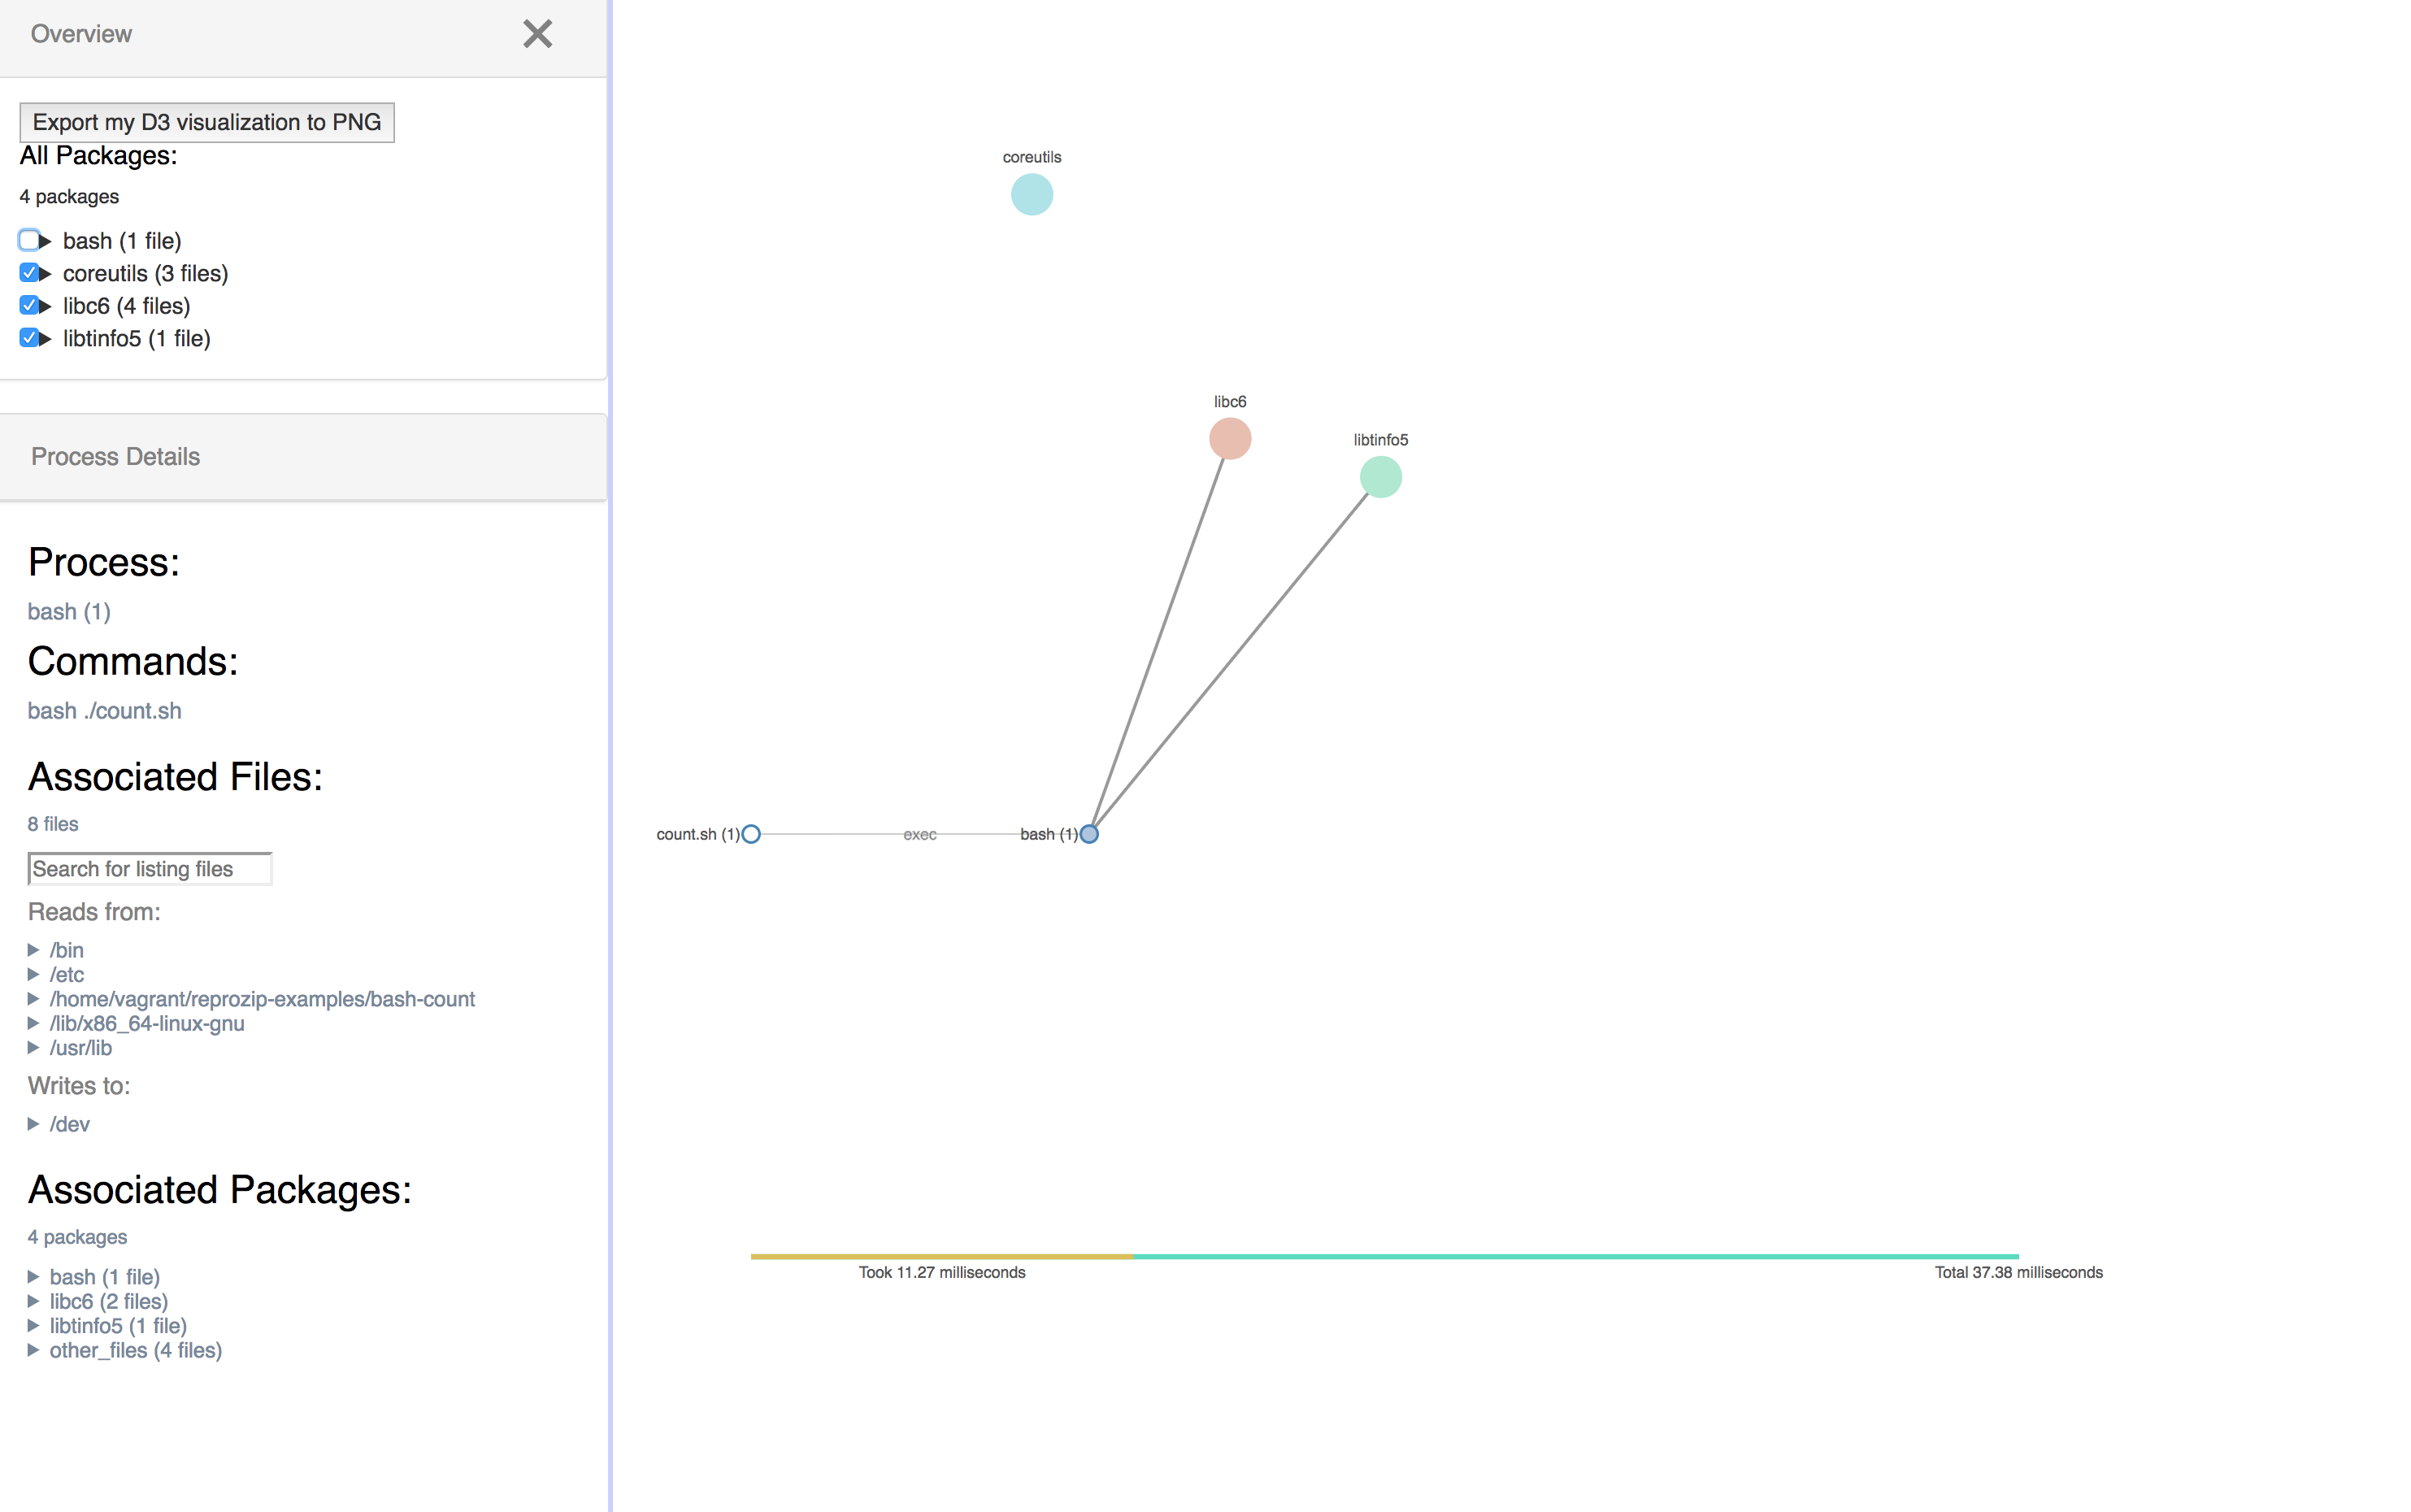
- Managed to accomplish "Export as PNG & SVG" with NYTimes svg-crowbar
- Managed to accomplish "When you click on a package, have it connect to the processes"
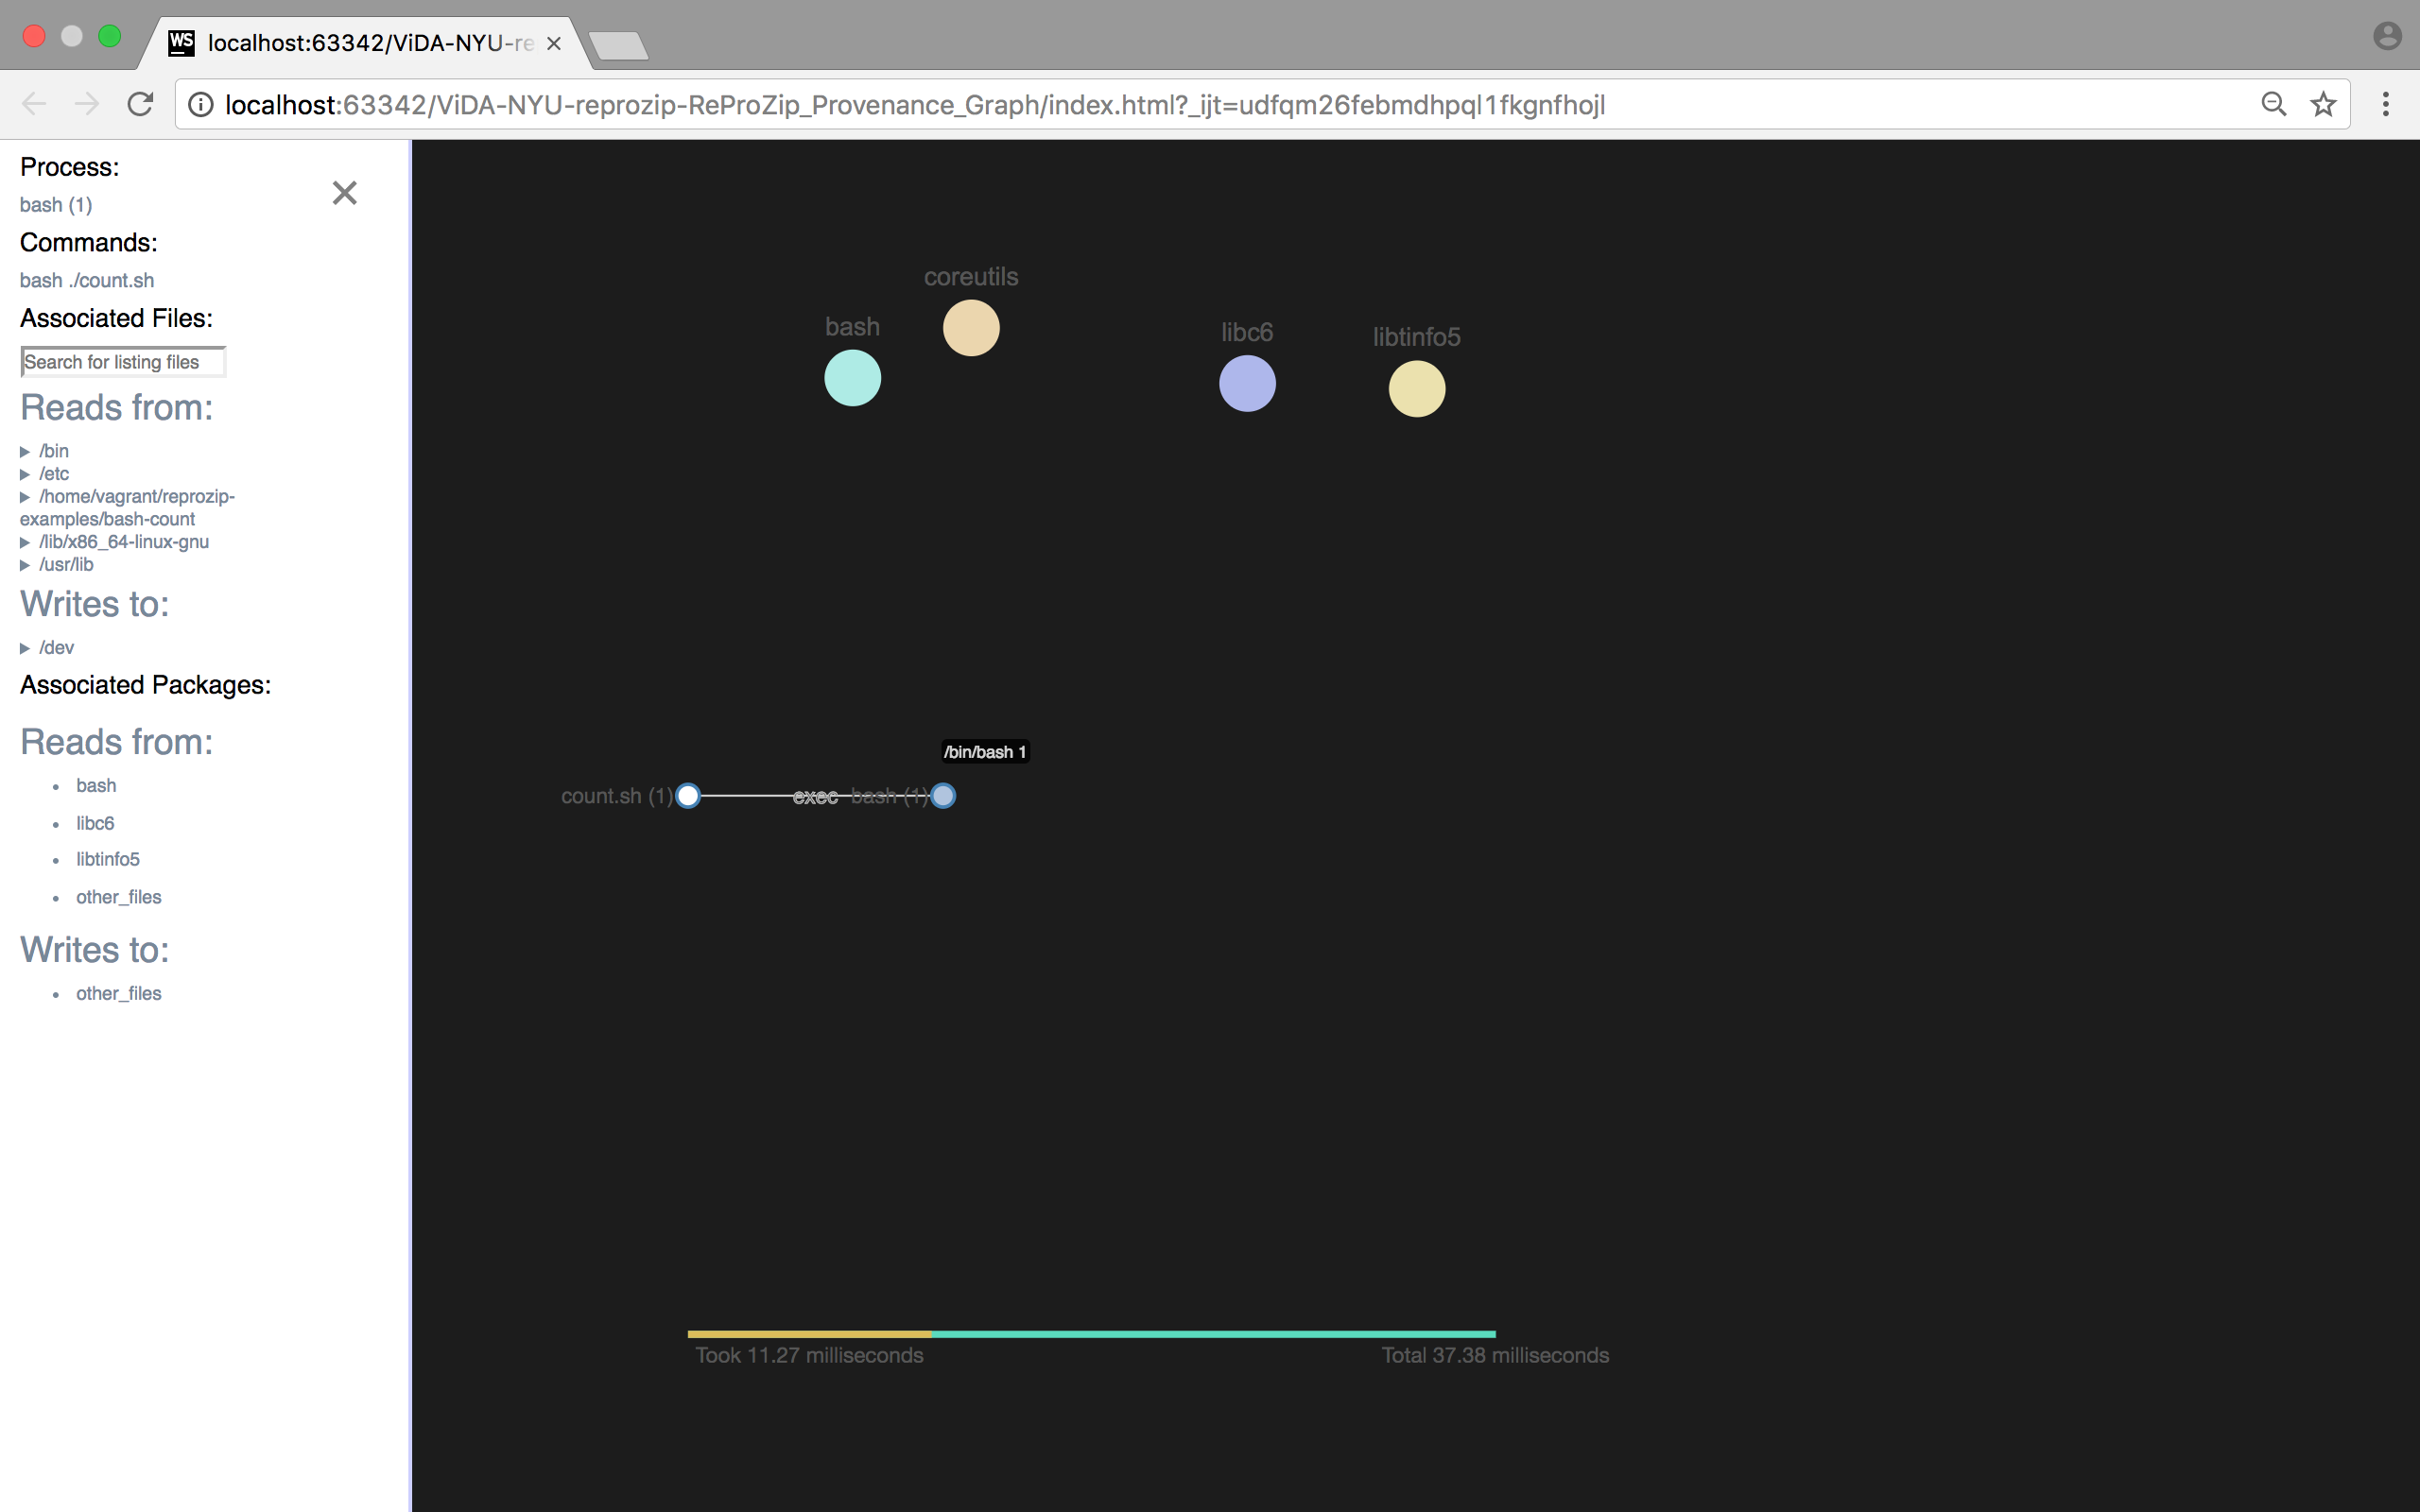
- Managed to accomplish "Use new "sections" from JSON to color packages"
- Continue to refactor the code and update the comments
- Further updated the sidebar for better look and feel
*Fixed the issues for both "expandable views in the sidebar: first entry doesn't have the hover effect" and "probably shouldn't be a hover on associated packages? (there are not links and don't have tooltips)"
- Managed to accomplish "When you click on a package, have it connect to the processes"
- Changed the in focus toggle to take immediate effect when focus toggle is on
- Updated the visualization according to Fernando's comments
- Continue to work on code refactoring according to Remi's comments
- Continue to work on code refactoring according to Remi's comments
*Fixed:
- Remove '/' at beginning of non-top-level paths
- Side bar show/hide icons are reversed
- Add button to show all package edges
- Resizing Window using $(window).resize() — Still need to review with Remi
- Differentiate double-click & single-click functions
- Code review with Remi
- Tried to use append the nodes into another 'g' elements so they will be appearing on top of the edges, however, it is not able to achieve what we wanted, so I will take further investigation on it.
- Setting the length of the timeline according to the max longest path for each tree diagram.
- Tried out Gantt chart with current timestamps
*Updates:
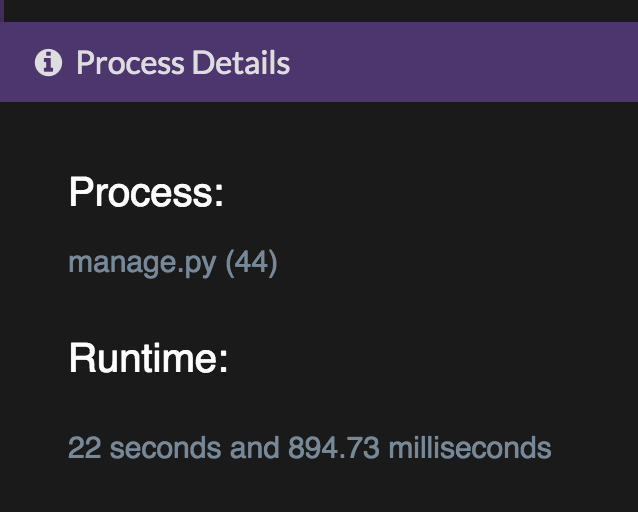
- Added the run time when a process is clicked
- Updated the mini timeline on the bottom to visualize the progress. So when this selected process is clicked, it will indicate where the entire experiment is up to when this process is completed
- Updates & Fixes:
- On sidebar, when a process is clicked, add total time it took to run
- If there is no timestamp, timeline will not show
- Fixed Timeline label cutoff due to screen size differences
- Enhancements and bugs fixing
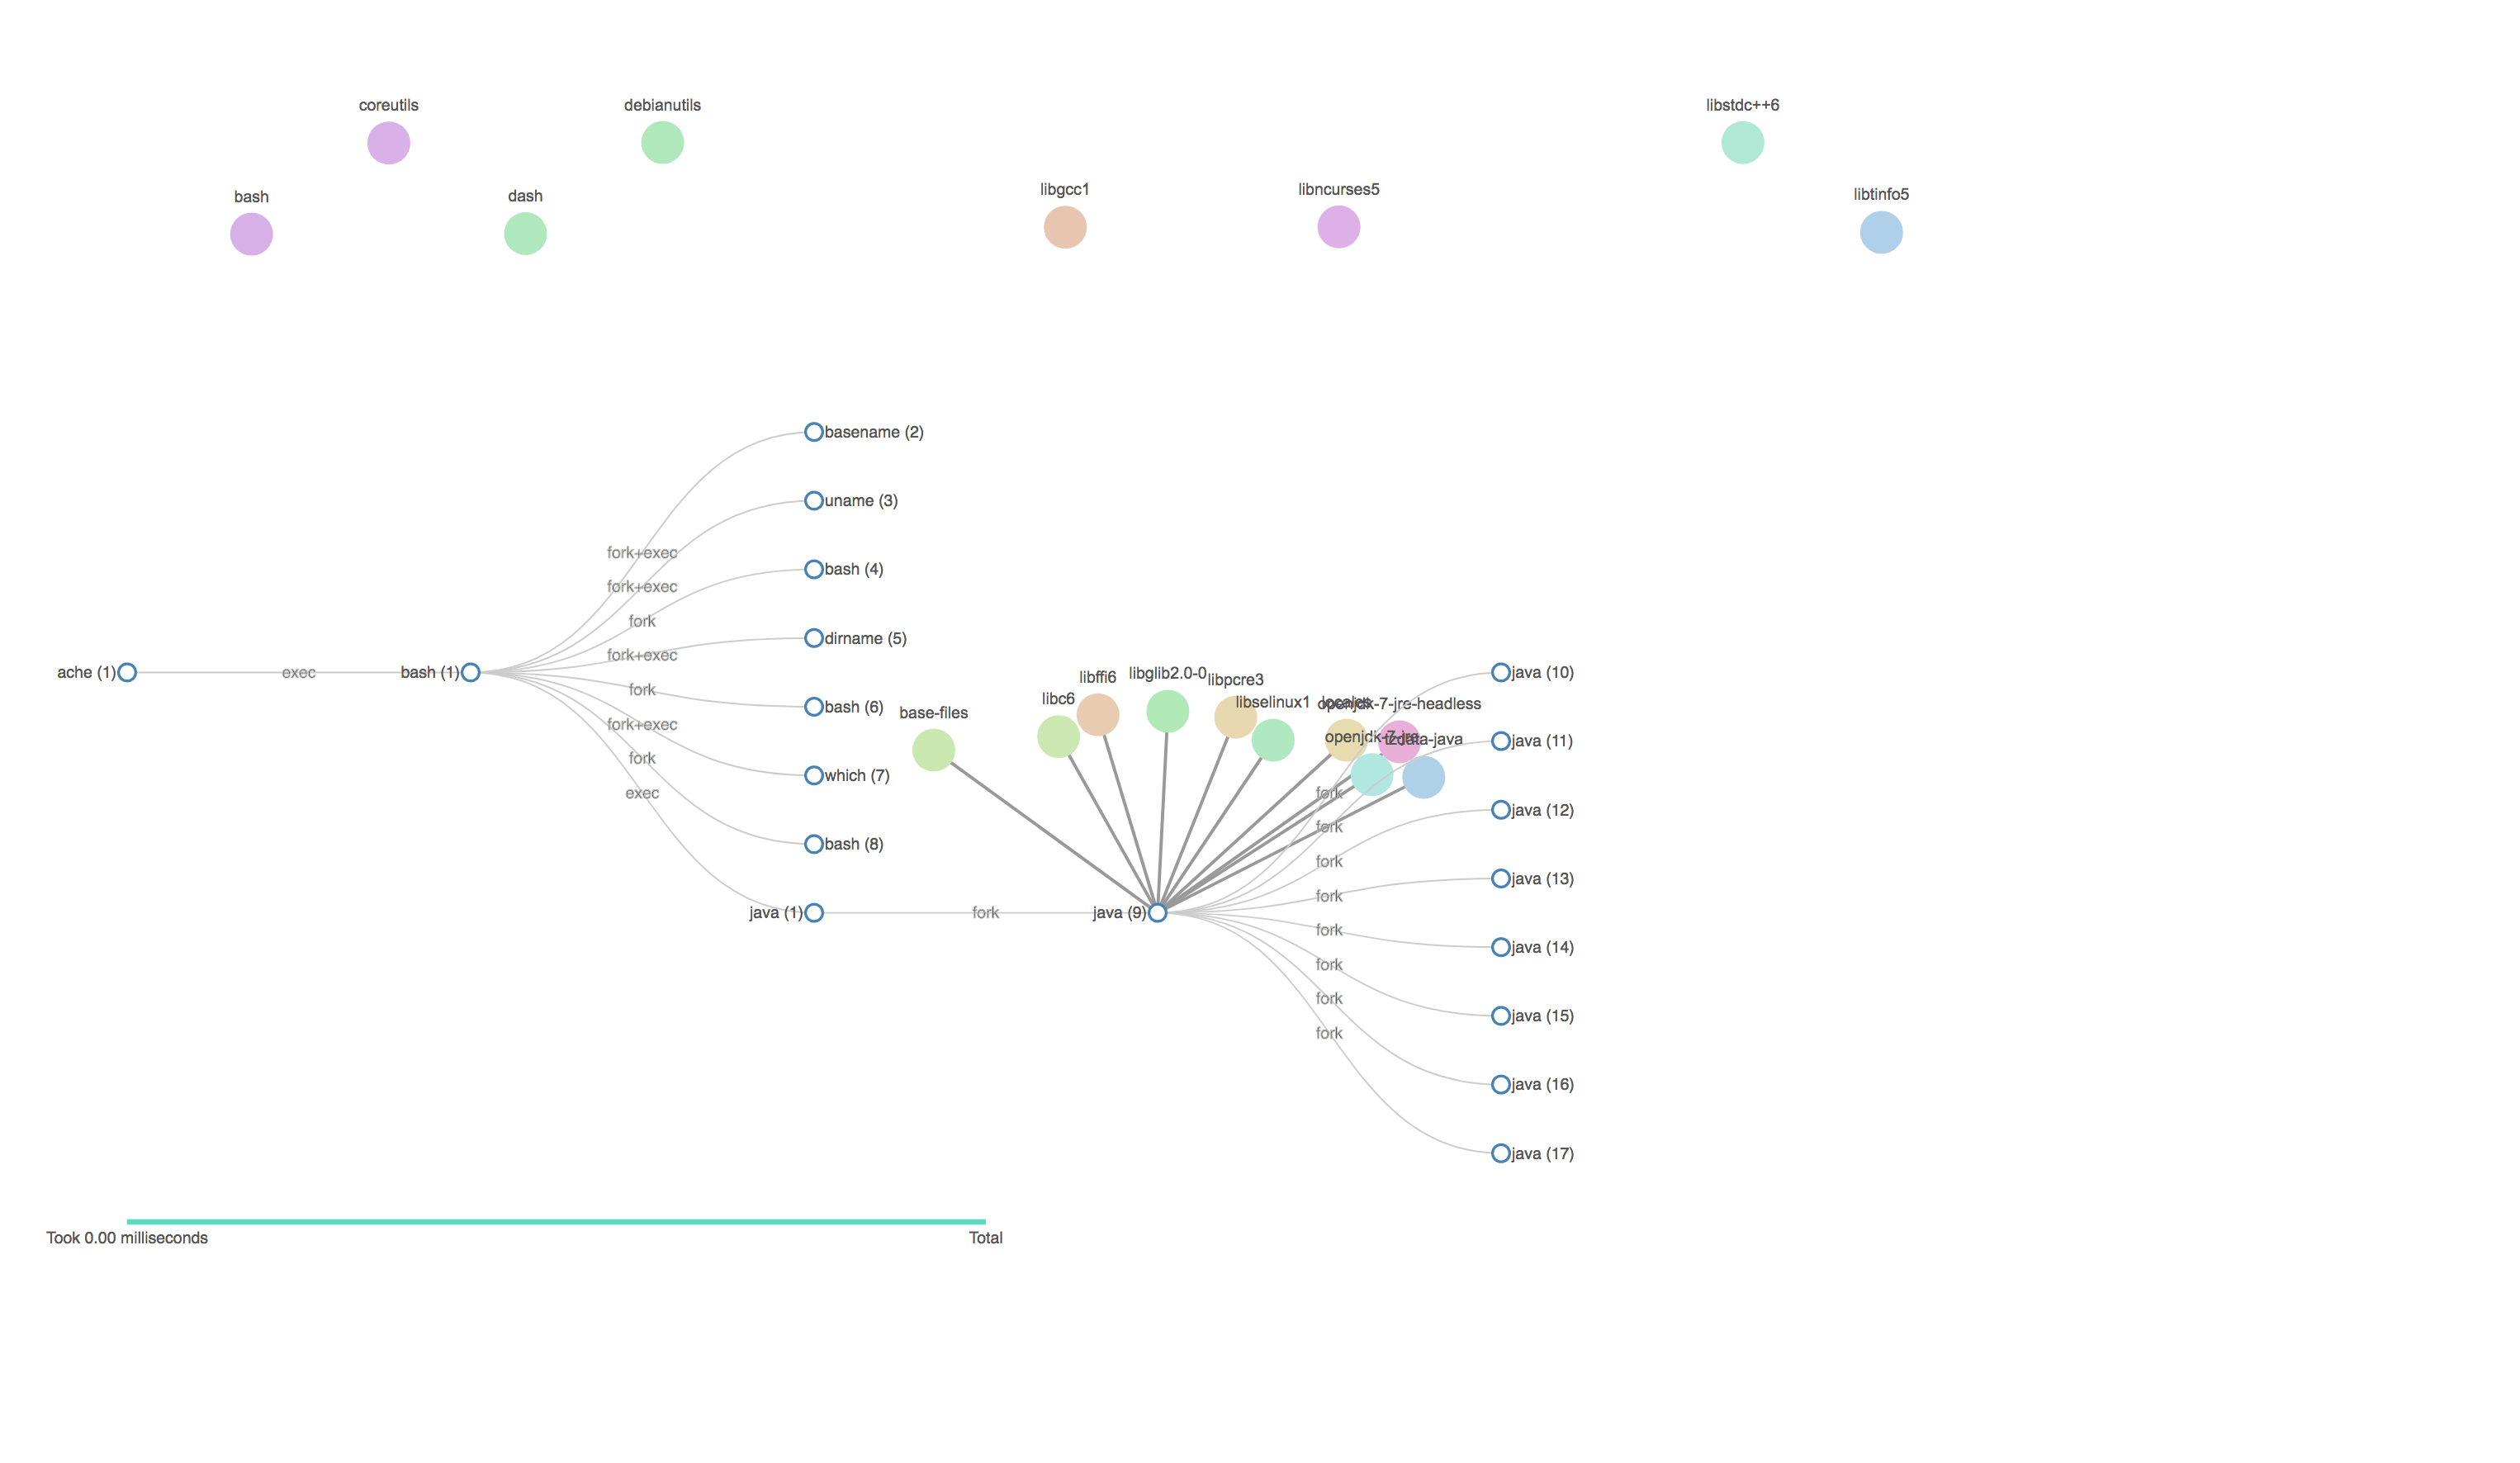
- Continue to work on make visualization works for digits json with multiple runs
- Display timeline when “Show Timeline” Button is click