- The amount of data used to represent a single pixel
| size | color options |
|---|---|
| 1 bit | 1 color, on | off |
| 2 bit | 1 color with intensity |
| 3 bit | Red, Green, Blue, on | off |
| 4 bit | RGB with intensity |
| 6 bit | RGB, each color has its own intensity |
| 3 byte | RGB, each with 256 possible intensities |
- RGBA
- Red, Green, Blue + Alpha (transparency)
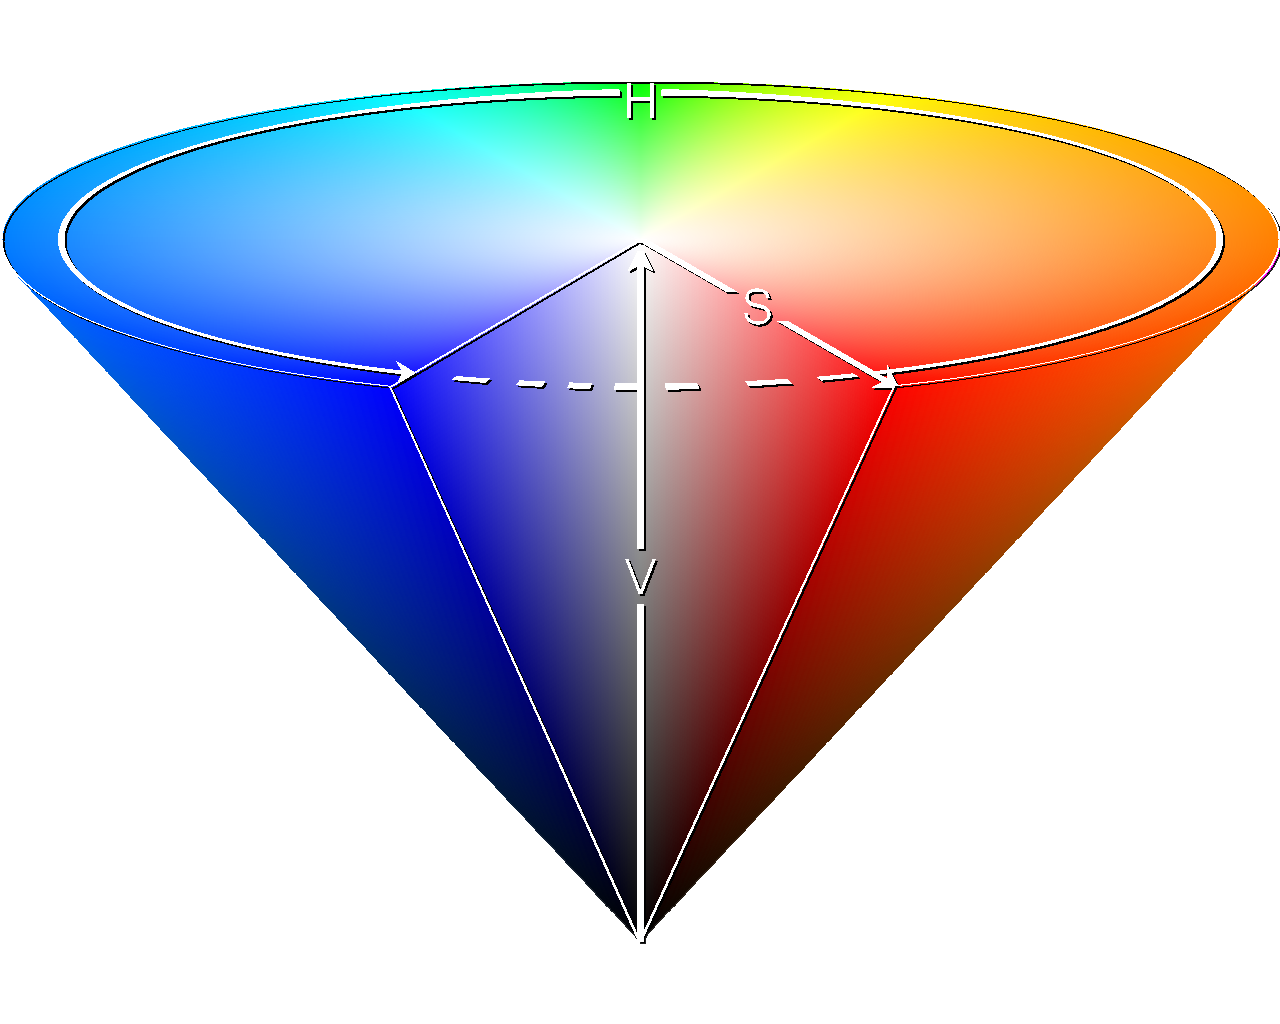
- HSB
- Hue, Saturation, Brightness
-
- Raster vs. Vector
- Vector formats represent images as a series of drawing instructions
- Infinitely scalable
- SVG (Scalable Vector Graphics)
- Raster formats represent images as a grid of pixels
- Vector formats represent images as a series of drawing instructions
- Uncompressed vs. Compressed (Raster)
- Uncompressed formats contain data for each pixel
- BMP, TIFF, RAW <!------- Thursday, January 30, 2020 ------->
- Compressed formats use a compression algorithm to minimize file size
- Lossless vs. Lossy
- Lossless compression algorithms contain enough information to exactly recreate the image
- Run Length Encoding
RRRRRGGBBBB-->R5G2BB4
- PNG (Portable Network Graphics), GIF (Graphics Interchange Format)
- Run Length Encoding
- Lossy compression algortihms do not retain all the details of the original image
- JPEG (Joint Photographic Experts Group)
- Lossless compression algorithms contain enough information to exactly recreate the image
- Uncompressed formats contain data for each pixel
- Uncompressed raster format
- Part of NETPBM Graphics family
- Pixel data is represented by RGB triplets in either ASCII or binary
- All whitespace is equivalent
- Ex ASCII ppm file (
pic.ppm)
P3
5 5
255
255 255 0 255 255 0 255 255 0 255 255 0 255 255 0
255 255 0 255 255 0 255 255 0 255 255 0 255 255 0
255 255 0 255 255 0 255 255 0 255 255 0 255 255 0
255 255 0 255 255 0 255 255 0 255 255 0 255 255 0
255 255 0 255 255 0 255 255 0 255 255 0 255 255 0
- Making a PPM file (line-by-line, but all whitespace is equivalent anyways):
- Must start with
P3if in ASCII,P6if in binary - Specify width then height
- Specify max value (will map 0->255 to 0->100 if you use
100) - Then your pixel triplets
- Note-to-self: leave the trailing space after last pixel; if not there, will give error about end-of-file when converting
- Must start with

Input: 2 endpoints
Ideas?:
- test potential pixels
- iterate through potential pixels
- one pixel per x-value*

Octant I: 0 < m < 1
Steps of Algorithm:
- Loop through
x_0-->x_1 Test(x+1, y)Test(x+1, y+1)- Pick best point
Pseudocode for Picking best point/pixel (OCTANT I) v0:
f(x, y) = Ax + By + C

x = x_0
y = y_0

while x <= x_1
    plot(x, y)
    d0 = f(x+1, y+1)
    d1 = f(x+1, y)

    if (abs(d0) < abs(d1))
        y = y+1
    x = x+1
Pseudocode for Picking best point/pixel (OCTANT I) v1:
f(x, y) = Ax + By + C

x = x_0
y = y_0

while x <= x_1
    plot(x, y)
    d = f(x+1, y+(1/2))

    if d > 0
        y = y+1
    x = x+1
Pseudocode for Picking best point/pixel (OCTANT I) v2:
f(x, y) = Ax + By + C

x = x_0
y = y_0
d = A + (1/2)B
while x <= x_1
    plot(x, y)

    if d > 0
        y = y+1
        d = d+B
    x = x+1
    d = d+A
Pseudocode for Picking best point/pixel (OCTANT I) v3:
f(x, y) = Ax + By + C

x = x_0
y = y_0
d = A + (1/2)B
while x <= x_1
    plot(x, y)

    if d > 0
        y = y+1
        d = d+B
    x = x+1
    d = d+A
Pseudocode for Picking best point/pixel (OCTANT I) v4:
f(x, y) = Ax + By + C

x = x_0
y = y_0
d = 2A + B
while x <= x_1
    plot(x, y)

    if d > 0
        y = y+1
        d = d+2B
    x = x+1
    d = d+2A
Pseudocode for Picking best point/pixel (OCTANT II):
x = x_0
y = y_0
d = A + 2B
while y <= y_1
    plot(x, y)

    if d <= 0
        x = x+1
        d = d+2A
    y = y+1
    d = d+2B
- we will store all the significant endpoints of our images in a single list/matrix
- we will maintain an edge matrix, where each pair of entries defines an edge
- points are (x,y) or (x,y,z) coordinates
- Matrix Multiplication (Review)
-
scale, translate, rotate
-
applied as matrix multiplication
-
Scale
-
(x,y,z) --- S_{a,b,c} ---> (ax,by,cz)
  [ a 0 0 0 ][ x ]   [ ax ]
  | 0 b 0 0 || y |   | by |
  | 0 0 c 0 || z | = | cz |
  [ 0 0 0 1 ][ 1 ]   [ 1  ]
-
-
Translate
-
(x,y,z) --- T_{a,b,c} ---> (x+a,y+b,z+c)
  [ 1 0 0 a ][ x ]   [ x+a ]
  | 0 1 0 b || y |   | y+b |
  | 0 0 1 c || z | = | z+c |
  [ 0 0 0 1 ][ 1 ]   [ 1   ]
-
-
Rotate
-
About the Z-Axis
-
(x,y,z) --- R_{theta,z-axis} ---> (xcosθ-ysinθ, xsinθ+ycosθ, z)
  [ cos(theta) -sin(theta) 0 0 ][ x ]   [ xcosθ-ysinθ ]
  | sin(theta) cos(theta)  0 0 || y |   | xsinθ+ycosθ |
  | 0          0           1 0 || z | = | z           |
  [ 0          0           0 1 ][ 1 ]   [ 1           ]
-
-
About the X-Axis
-
(x,y,z) --- R_{theta,x-axis} ---> (x,ycosθ-zsinθ,ysinθ+zcosθ)
  [ 1 0          0           0 ][ x ]   [ x           ]
  [ 0 cos(theta) -sin(theta) 0 ]| y |   | ycosθ-zsinθ |
  | 0 sin(theta) cos(theta)  0 || z | = | ysinθ+zcosθ |
  [ 0 0          0           1 ][ 1 ]   [ 1           ]
-
-
About the Y-Axis
-
(x,y,z) --- R_{theta,z-axis} ---> (xcosθ+zsinθ,y,zcosθ-xsinθ)
  [ cos(theta)  0 sin(theta) 0 ][ x ]   [ xcosθ+zsinθ ]
  [ 0           1 0          0 ]| y |   | y           |
  | -sin(theta) 0 cos(theta) 0 || z | = | zcosθ-xsinθ |
  [ 0           0 0          1 ][ 1 ]   [ 1           ]
-
-
-
Combining Transformations
- E0: Edge Matrix, T: Translate Matrix, R: Rotate Matrix, S: Scale Matrix
- T * E0 = E1 (Translated)
- R * E1 = E2 (Translated, Rotated)
- S * E2 = E3 (Translated, Rotated, Scaled)
- E3 = S * R * T * E0