


The proffer package profiles R code to find bottlenecks. Visit
https://r-prof.github.io/proffer for documentation.
https://r-prof.github.io/proffer/reference/index.html has a complete
list of available functions in the package.
This data processing code is slow.
system.time({
  n <- 1e5
  x <- data.frame(x = rnorm(n), y = rnorm(n))
  for (i in seq_len(n)) {
    x[i, ] <- x[i, ] + 1
  }
  x
})
#>   user  system elapsed
#> 82.060  28.440 110.582
Why exactly does it take so long? Is it because for loops are slow as
a general rule? Let’s find out empirically.
library(proffer)
px <- pprof({
n <- 1e5
x <- data.frame(x = rnorm(n), y = rnorm(n))
for (i in seq_len(n)) {
x[i, ] <- x[i, ] + 1
}
x
})
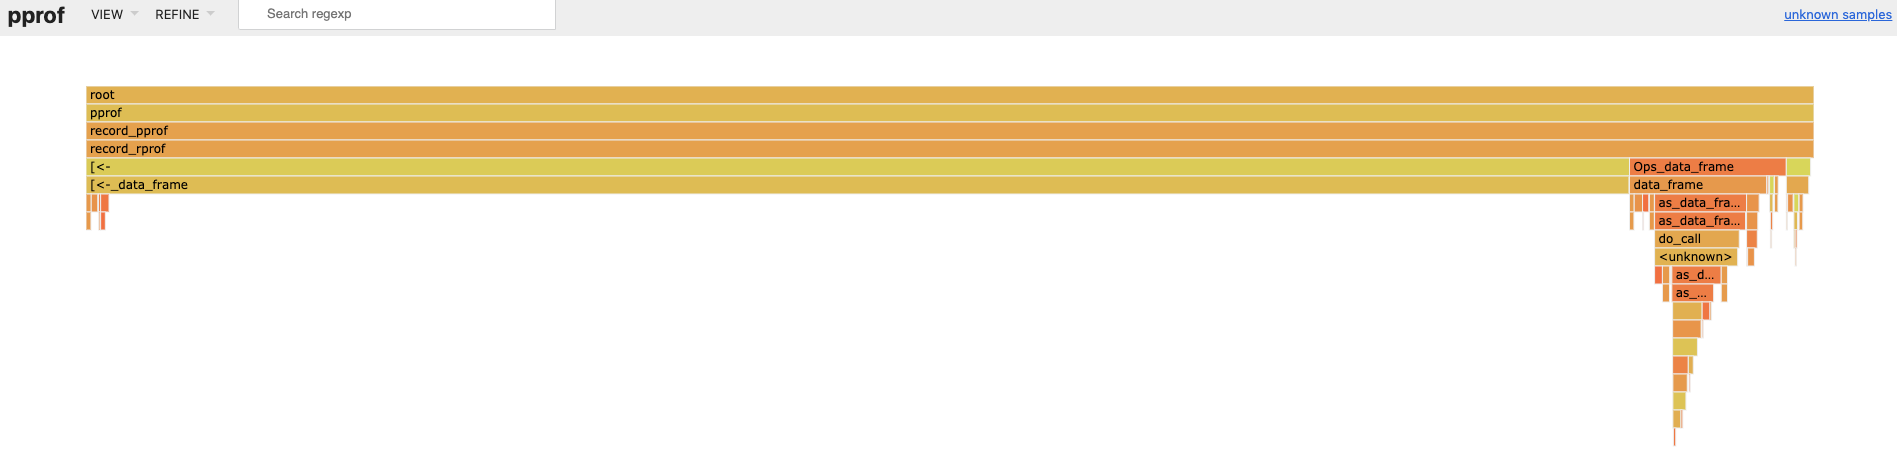
#> http://localhost:64610When we navigate to http://localhost:64610 and look at the flame
graph, we see [<-.data.frame() (i.e. x[i, ] <- x[i, ] + 1) is taking
most of the runtime.
So we refactor the code to avoid data frame row assignment. Much faster,
even with a for loop!
system.time({
  n <- 1e5
  x <- rnorm(n)
  y <- rnorm(n)
  for (i in seq_len(n)) {
    x[i] <- x[i] + 1
    y[i] <- y[i] + 1
  }
  x <- data.frame(x = x, y = y)
})
#>    user  system elapsed
#>   0.046   0.001   0.048
Moral of the story: before you optimize, throw away your assumptions and run your code through a profiler. That way, you can spend your time optimizing where it counts!
Sometimes, your pprof server may not work right away. If that happens,
take a look at the error logs.
px <- pprof({
  n <- 1e4
  x <- data.frame(x = rnorm(n), y = rnorm(n))
  for (i in seq_len(n)) {
    x[i, ] <- x[i, ] + 1
  }
  x
})
#> http://localhost:50195

px # How is my background process doing?
#> PROCESS 'R', finished.
px$is_alive()
# [1] FALSE

px$read_error() # Why did it quit soon?
#> [1] "sh: /user/local/bin/pprof: No such file or directory\nWarning message:\nIn system2(Sys.getenv(\"pprof_path\"), args) : error in running command\n"

# Can my system find pprof?
test_pprof()
#> Error: cannot find pprof executable. See the setup instructions at https://r-prof.github.io/proffer.
assert_pprof()
#> Error: cannot find pprof executable. See the setup instructions at https://r-prof.github.io/proffer.
pprof_path()
#> ""

# Maybe my system cannot find the pprof executable.
# Let me find out where I actually installed pprof.
system("which", "pprof")
#> "/home/landau/alternative/path/pprof"

# I can put a line in my .Rprofile or .Renviron file
# to automatically tell new sessions where pprof lives.
Sys.setenv(pprof_path = "/home/landau/alternative/path/pprof")

# Now, pprof should work.
px <- pprof({
  n <- 1e4
  x <- data.frame(x = rnorm(n), y = rnorm(n))
  for (i in seq_len(n)) {
    x[i, ] <- x[i, ] + 1
  }
  x
})
#> http://localhost:64610

px
#> PROCESS 'R', running, pid 12361.
px$is_alive()
# [1] TRUE

# Now a web browser should be able to open http://localhost:64610.
It is best to take down the pprof server when you are done with it.
px$kill()px is the handle of a callr
background process. To learn more about how to manage the process, have
a look at the callr documentation,
particularly the function
r_bg().
The latest release of proffer is available on
CRAN.
install.packages("proffer")Alternatively, you can install the development version from GitHub.
# install.packages("remotes")
remotes::install_github("r-prof/proffer")
To use functions pprof() and serve_pprof(),
pprof needs to be installed.
Installing pprof is hard, so if you have trouble, please do not
hesitate to open an issue
and ask for help. And if you cannot install pprof, then
profvis is an excellent
alternative.
As you follow the installation instructions below, you can run
test_pprof(), assert_pprof(), or pprof_path() at any time to see
if proffer can find and use pprof. If these functions succeed early,
you are already done.
- Install the
RProtoBufpackage. On Linux, you also need to install the supporting protocol buffer libraries, e.g.sudo apt-get install protobuf-compiler libprotobuf-dev libprotoc-devon Ubuntu. - Install Graphviz and ensure the Graphviz
executables appear in your
PATHenvironment variable (directions here). - Install the Go programming language.
- Ensure your system can find the Go binaries. Open your command line
interface of choice (e.g. Terminal or Command Prompt) and type
go version. If you get an error, you may need to set thePATHenvironment variable as described here for Linux and here for Windows - Follow these
instructions to
set the
GOPATHenvironment variables on your system. Typego env GOPATHin in a new terminal session verify that you set it correctly. - Enter
go get -u github.com/google/pprofin your terminal to installpprof - Find the path to the
pprofexecutable. It is usually in thebinsubdirectory ofGOPATH, e.g./home/landau/go/bin/pprof. - Add a line to your
.Renvironfile to set thepprof_pathenvironment variable, e.g.pprof_path=/home/landau/go/bin/pprof. This variable tellsprofferhow to findpprof. - Open a new R session check that pprof installed correctly.
Sys.getenv("pprof_path")
#> /home/landau/go/bin/pprof
file.exists(Sys.getenv("pprof_path"))
#> TRUE
system2(Sys.getenv("pprof_path")) # Shows the pprof help menu on Unix systems.
shell(Sys.getenv("pprof_path")) # Analogous for Windows.We encourage participation through
issues and pull
requests. proffer has a
Contributor Code of
Conduct. By contributing
to this project, you agree to abide by its terms.
Profilers identify bottlenecks, but the do not offer solutions. It helps to learn about fast code in general so you can think of efficient alternatives to try.
- http://adv-r.had.co.nz/Performance.html
- https://www.r-bloggers.com/strategies-to-speedup-r-code/
- https://www.r-bloggers.com/faster-higher-stonger-a-guide-to-speeding-up-r-code-for-busy-people/
- https://cran.r-project.org/web/packages/data.table/vignettes/datatable-intro.html
The profvis is much easier to
install than proffer and equally easy to invoke.
library(profvis)
profvis({
  n <- 1e5
  x <- data.frame(x = rnorm(n), y = rnorm(n))
  for (i in seq_len(n)) {
    x[i, ] <- x[i, ] + 1
  }
  x
})
However, profvis-generated flame graphs can be difficult to
read and slow to
respond to mouse
clicks.
proffer uses pprof to create
friendlier, faster visualizations.