Skip to content

ksmnetwork/Total-Panic

Folders and files

NameName
Last commit message
Last commit date

Latest commit


History

1 Commit


Repository files navigation

TOTAL Panic

KUSAMA and PolkaDOT Telemetry Monitoring with Grafana Cloud and JSON API

Steps:

  • Create Grafana Cloud Account
  • Install JSON API Plugin
  • Add the endpoint Candidates
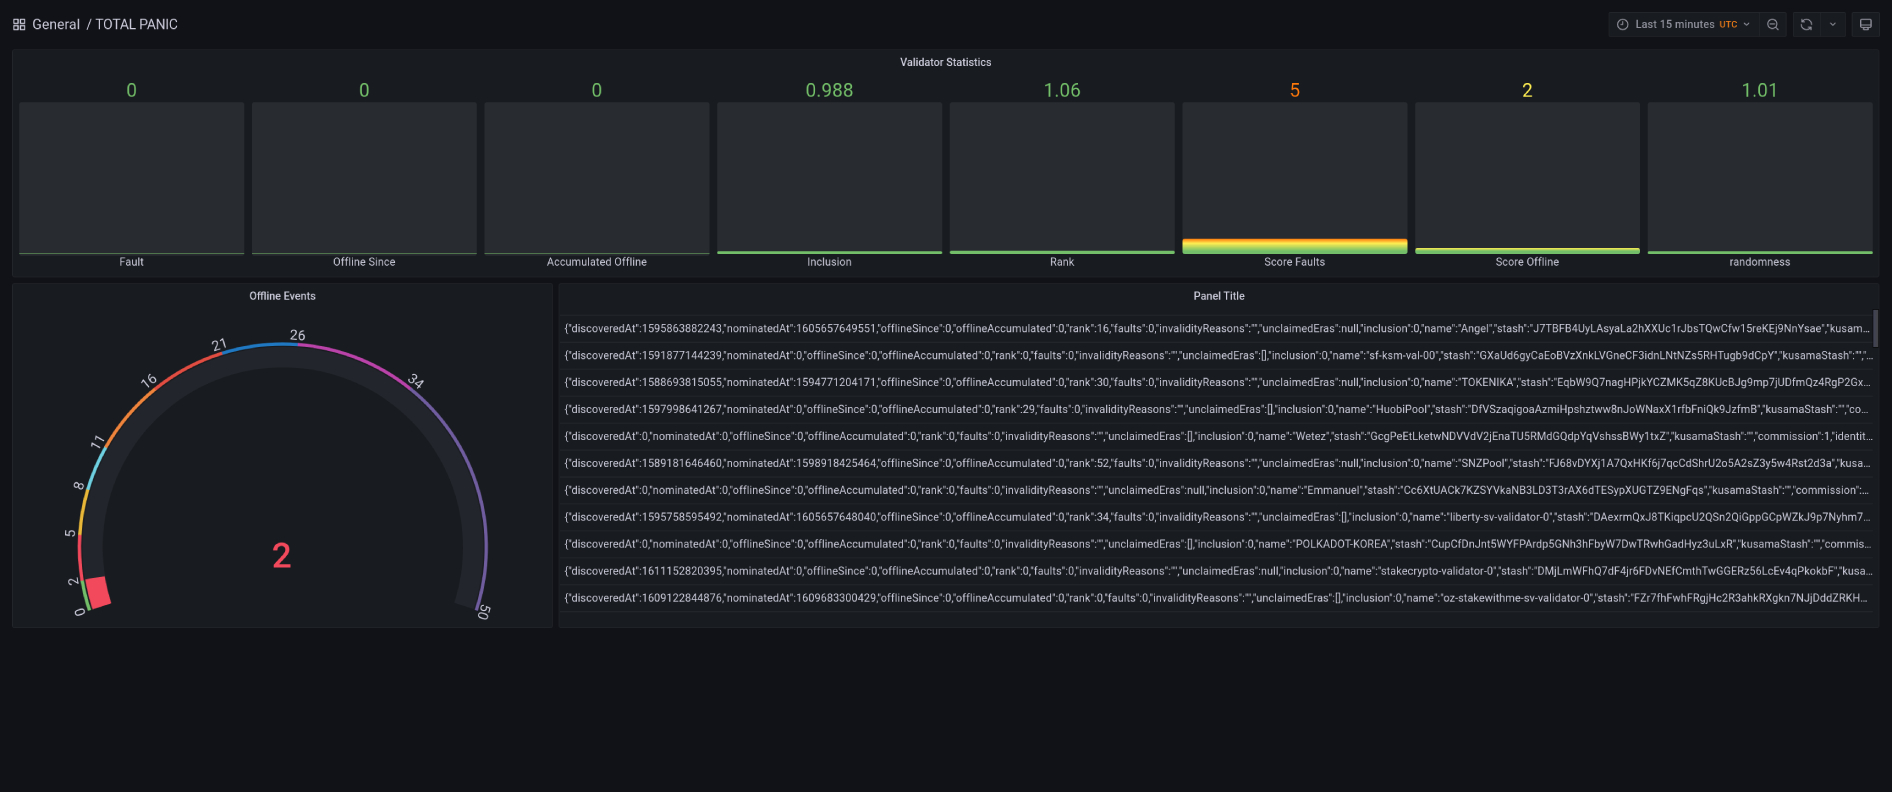
  • Add the Simple Dashboard Dashboard

Settings

Set your settings to obtain the information at least on minimum 5m to do not DDos it.

Grafana sets also quite small timeouts check them as well

Filter is casesensitive

About

No description, website, or topics provided.

Resources

Stars

Watchers

Forks

Releases

No releases published

Packages

No packages published