Error when trying to visualize 'Time Series - Line Chart' -- Error message is unclear #5700
Comments
|
So, I managed to find a solution. Looking at the discussion in Issue #4770, it didn't feel quite the same issue as the one displayed here. This is how I managed to solve it:
Comparing to Issue #4770, I am editing the labels used in the Chart and not the datasource column names. |

|
@HectorLira what database engine are you using? Furthermore, have you tested |
|
My database engine is Amazon Redshift. I have tried using PostgreSQL and the problem doesn't seem to appear there. Haven't tried |
|
@HectorLira Redshift is one of three engines that has been causing a lot of grief when used with Superset. There's a PR in the making that I hope will tackle these problems for good. I would appreciate it if you can help testing it once it is done (main functionality is ready, working on some final details). |
|
@villebro I am encountering the same issue as @HectorLira, but the solution of lowercasing the sum does not seem to fix the issue for me. I am running on docker image on master branch: https://github.com/apache/incubator-superset/tree/master/contrib/docker Any idea how to check which version of superset the docker image is running? |
|
Thanks @rae89 for the feedback. As Superset recently migrated to using dbapi1 for queries, the quickfix now is uppercasing everything rather than lowercasing column bames. I'm working on a fix for Redshift in #5827 and should have something to test later today, and would appreciate testing help/feedback, especially from Redshift users. |
|
@villebro I am willing to help with testing out changes for redshift. Which version should I be trying out? And since I am using the docker contrainer to test out superset, how do I change the superset version in the docker container, or is the container building the version that is checked out? |
|
I face the same issue. I use postgresql I will get Unexpected error while using time series char if I select time grain. (my date time type is timestamp without time zone)
|


|
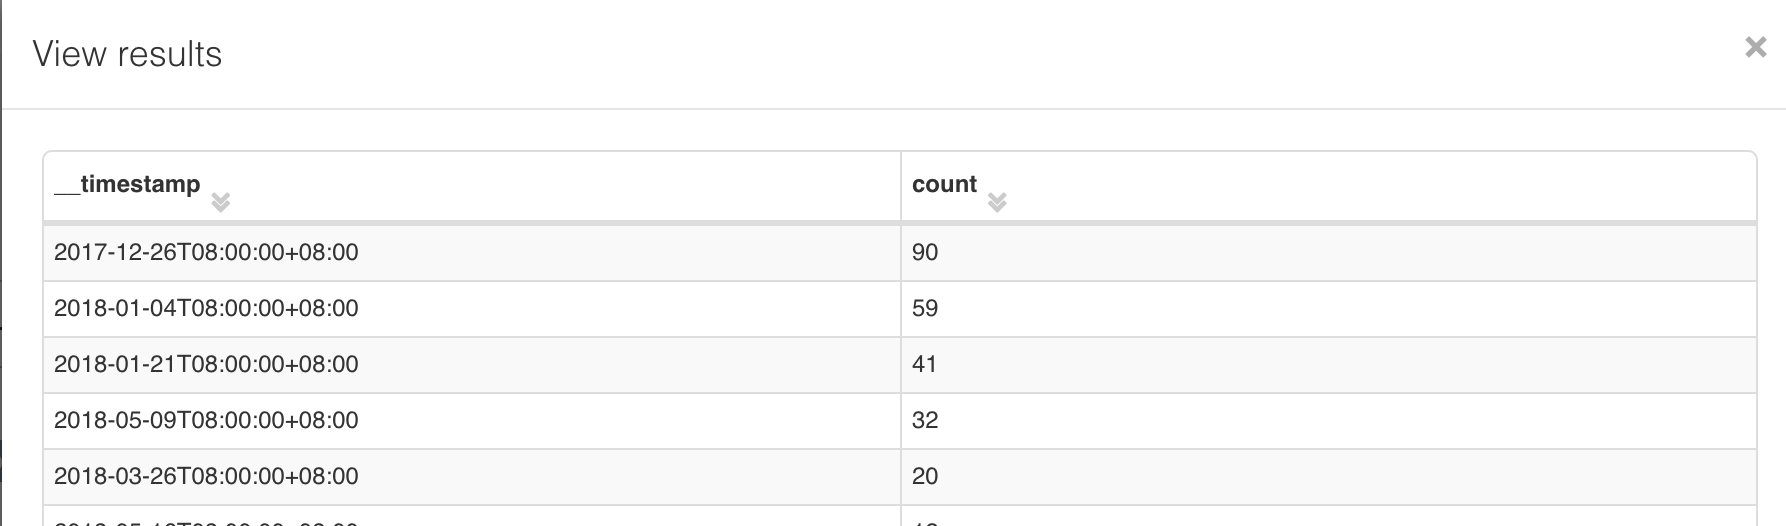
@pc042672 I was getting the same error when using the time series chart and selecting time grain. I was able to use time grain successfully by building the same query from SQL Lab and declaring a time zone for my time column. Here is an image of the final query Superset uses to graph and now I can use the time grain freely (even with filter boxes). The name of my time column is timestamp, this is why I have to use double quotes to reference the column. |

|
@pc042672 would you mind opening a new issue for this? I have a fix for the original issue that's nearing completion and don't mind working on the postgres timestamp time grain issue too, but I would prefer to keep them in two separate PRs to isolate any potential problems they might introduce. |
|
I am facing the same issue but with BigQuery as our database engine. Both with and without a time grain I get a yellow warning message stating: Here's the query it generates: SELECT TIMESTAMP_TRUNC(created, DAY) AS `__timestamp`,
SUM(`pings`) AS `SUM_pings_`
FROM `table`
WHERE `created` >= '2018-08-14 00:00:00'
AND `created` <= '2018-09-11 13:30:56'
GROUP BY `__timestamp`
ORDER BY `SUM_pings_` DESC
LIMIT 5000; |
|
It looks like the PR that solves this is approved - is there any word on when it will ship? This is pretty much blocking us from using Superset seriously right now. |
|
@jdavidheiser if you have the opportunity to try out the PR (#5827) I would appreciate any feedback. Also @millar sorry for having missed the comment in September; the aforementioned PR should fix that, too. The |
|
This issue has been automatically marked as stale because it has not had recent activity. It will be closed if no further activity occurs. Thank you for your contributions. |
|
@HectorLira I believe this can be closed. |
|
This issue has been automatically marked as stale because it has not had recent activity. It will be closed if no further activity occurs. Thank you for your contributions. For admin, please label this issue |
Make sure these boxes are checked before submitting your issue - thank you!
Superset version
0.26.3
Expected results
Time Series - Line Chart rendered.
Actual results
Error with no clear message.
Steps to reproduce
Create a query in SQL Lab with a datetime column and an integer column (or just use any datasource that has a datetime column and group by that column to count the number of rows)
Click on 'Explore' to visualize the resulting table

Choose Time Series - Line Chart as an option to visualize
Add your integer column as value for the 'Metrics' option
Click on 'Run Query'

Here is the trackeback I get:
The traceback doesn't seem to be helpful.
This is the query that is generated automatically to visualize the resulting table:
I've tried the following to see if it works:
The text was updated successfully, but these errors were encountered: