Improve Custom D3 Formatting for Source Columns on table viz type #10729
Labels
enhancement:request
Enhancement request submitted by anyone from the community
Comments
|
Issue-Label Bot is automatically applying the label Links: app homepage, dashboard and code for this bot. |
|
This issue has been automatically marked as stale because it has not had recent activity. It will be closed if no further activity occurs. Thank you for your contributions. For admin, please label this issue |
|
If my understanding is correct, this is still missing.
Or else I am missing somthing... I am using 0.38.0 |

6 tasks
Sign up for free
to join this conversation on GitHub.
Already have an account?
Sign in to comment
Is your feature request related to a problem? Please describe.
Currently not all viz types allows users to user d3 formatting for their data. For example viz type big number with trendline allows this, but table viz type doesn't. There is a hacky workaround, where users can specify this in the edit Datasource --> Calculated Column section, but it would be much better user experience, is they can do it in the explore itself.
Current hacky solution:

Describe the solution you'd like
Enable users to easily define their column type on table viz, specifically custom d3 formatting.
Describe alternatives you've considered
Current solution works but is really hacky and non intuitive for users.
Option 1: Let users edit when clicking on column name in Explore table viz.

Option 2: Add a dropdown with formatting options in Edit Datasource --> Calcualted Column section
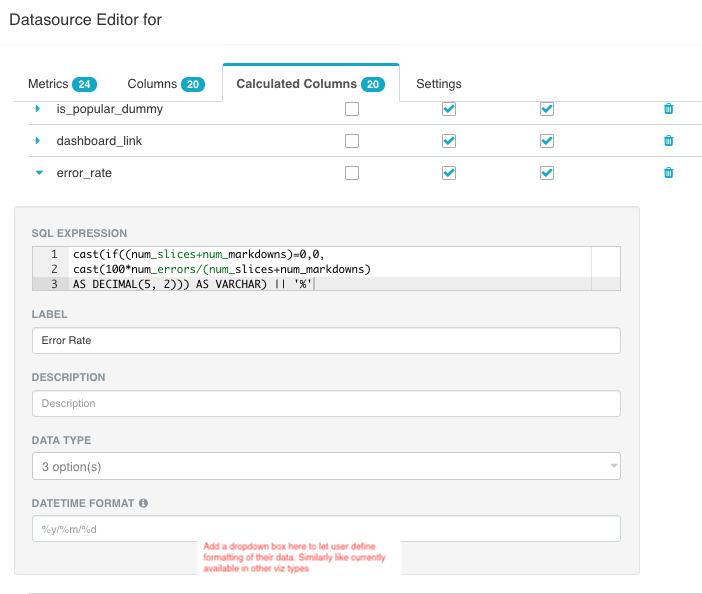
.. Similar is available on big trendline viz type and other viz types
Option 3: Enable both option (1) and (2), where option (1) saves the settings, but can also be visible and edited via option (2). This would provide users most flexibility.
Additional context
It would be great to also go through all the viz types and if there are other which don't allow this functionality, enable this for all viz types with as much consistency in the settings as possible across.
The text was updated successfully, but these errors were encountered: