Skip to content
New issue

Have a question about this project? Sign up for a free GitHub account to open an issue and contact its maintainers and the community.

By clicking “Sign up for GitHub”, you agree to our terms of service and privacy statement. We’ll occasionally send you account related emails.

Already on GitHub? Sign in to your account

feat(axis): Add minorTick and minorSplitLine #11705

Merged
merged 3 commits into from
Nov 28, 2019
Merged

feat(axis): Add minorTick and minorSplitLine #11705

merged 3 commits into from
Nov 28, 2019

Conversation

pissang
Copy link
Contributor

@pissang pissang commented Nov 22, 2019

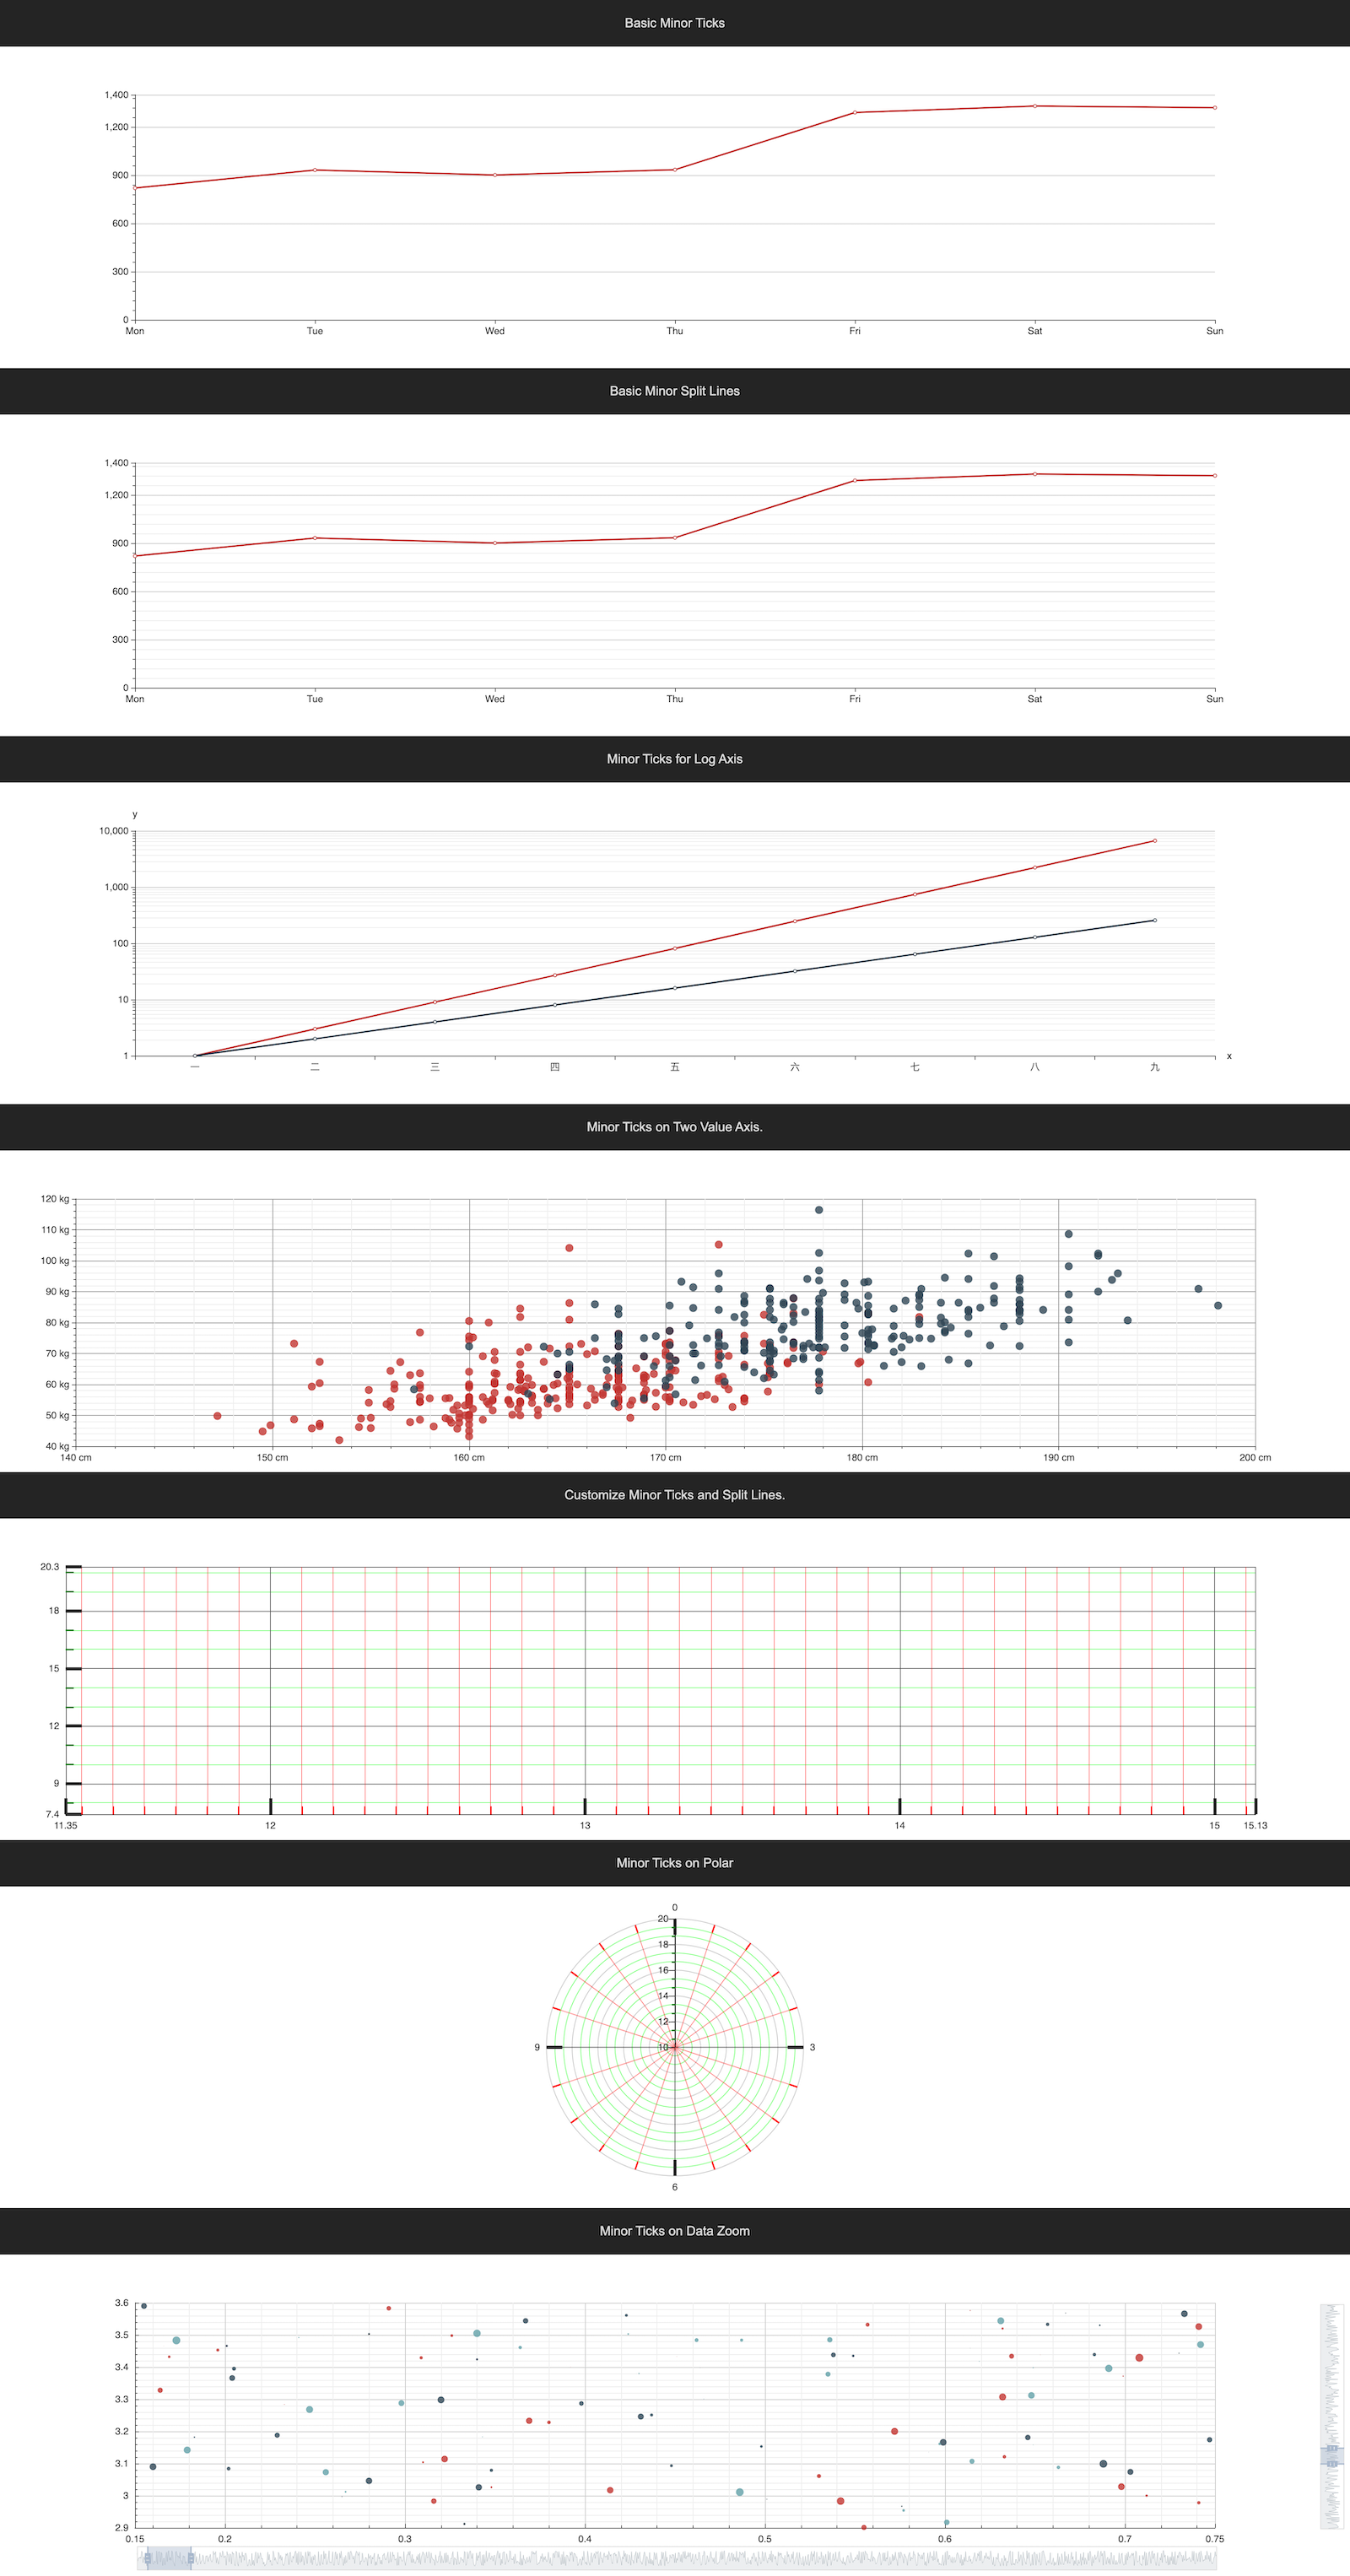
This is a pull request about adding minorTicks, minorSplitLines to axes of carteisan2d and polar coordinate system. It not support category type axis.

Usage:

xAxis: {
    axisTick: {
        // inside will also affect minorTick.
        inside: true,
        length: 20,
        lineStyle: {
            width: 4
        }
    },
    minorTick: {
        show: true,
        length: 10,
        splitNumber: 10,
        lineStyle: {
            color: 'red',
            width: 2
        }
    },
    minorSplitLine: {
        show: true,
        lineStyle: {
            color: 'rgba(255, 0, 0, 0.5)'
        }
    }
}

The default option is in https://github.com/apache/incubator-echarts/compare/minor-ticks?expand=1#diff-af7ed0ab793833949acec7caafa8646eR180

Here is some shots.

With dataZoom.
minor-ticks

All tests.
screencapture-localhost-echarts-test-axis-minorTick-html-2019-11-22-23_55_55

100pah
100pah previously approved these changes Nov 27, 2019
fixMinMaxLabelShow(axisModel, labelEls, tickEls);
fixMinMaxLabelShow(axisModel, labelEls, ticksEls);

buildMinorAxisTicks(this, axisModel, opt);
Copy link
Member

Choose a reason for hiding this comment

The reason will be displayed to describe this comment to others. Learn more.

buildAxisMajorTicks buildMinorAxisTicks.

maybe buildAxisMajorTicks buildAxisMinorTicks.
or buildMajorAxisTicks buildMinorAxisTicks.
is better.

But it's not important.

@@ -85,6 +77,9 @@ var CartesianAxisView = AxisView.extend({
this._splitAreaColors = null;
},

_createSplitLines: function () {
Copy link
Member

Choose a reason for hiding this comment

The reason will be displayed to describe this comment to others. Learn more.

?

return [];
}

opt = opt || {};
Copy link
Member

Choose a reason for hiding this comment

The reason will be displayed to describe this comment to others. Learn more.

The opt seams not be used.

@pissang pissang merged commit b673279 into master Nov 28, 2019
@pissang pissang deleted the minor-ticks branch November 28, 2019 09:54
pissang added a commit that referenced this pull request Dec 2, 2019
fix(polar): fix axis line not display in polar caused by #11705
@pissang pissang changed the title feat(axis): Add minorTicks and minorSplitLines feat(axis): Add minorTick and minorSplitLine Dec 2, 2019
@petersonzilli
Copy link

This feature has a bug when used in a dynamic timeseries plot:
it always draws all the 5 ticks (in the example below) leading to a incorrect minorTicks spacing behavior for the right and left-most intervals
As presented in the open issue #18422

How can we correct this issue?

@GordoRank
Copy link

This feature has a bug when used in a dynamic timeseries plot: it always draws all the 5 ticks (in the example below) leading to a incorrect minorTicks spacing behavior for the right and left-most intervals As presented in the open issue #18422

How can we correct this issue?

I don't have the time to properly contribute right now as i'm completely swamped, but I've provided a fix for this bug in the comments of issue #18422

Sign up for free to join this conversation on GitHub. Already have an account? Sign in to comment
Projects
None yet
Development

Successfully merging this pull request may close these issues.

4 participants