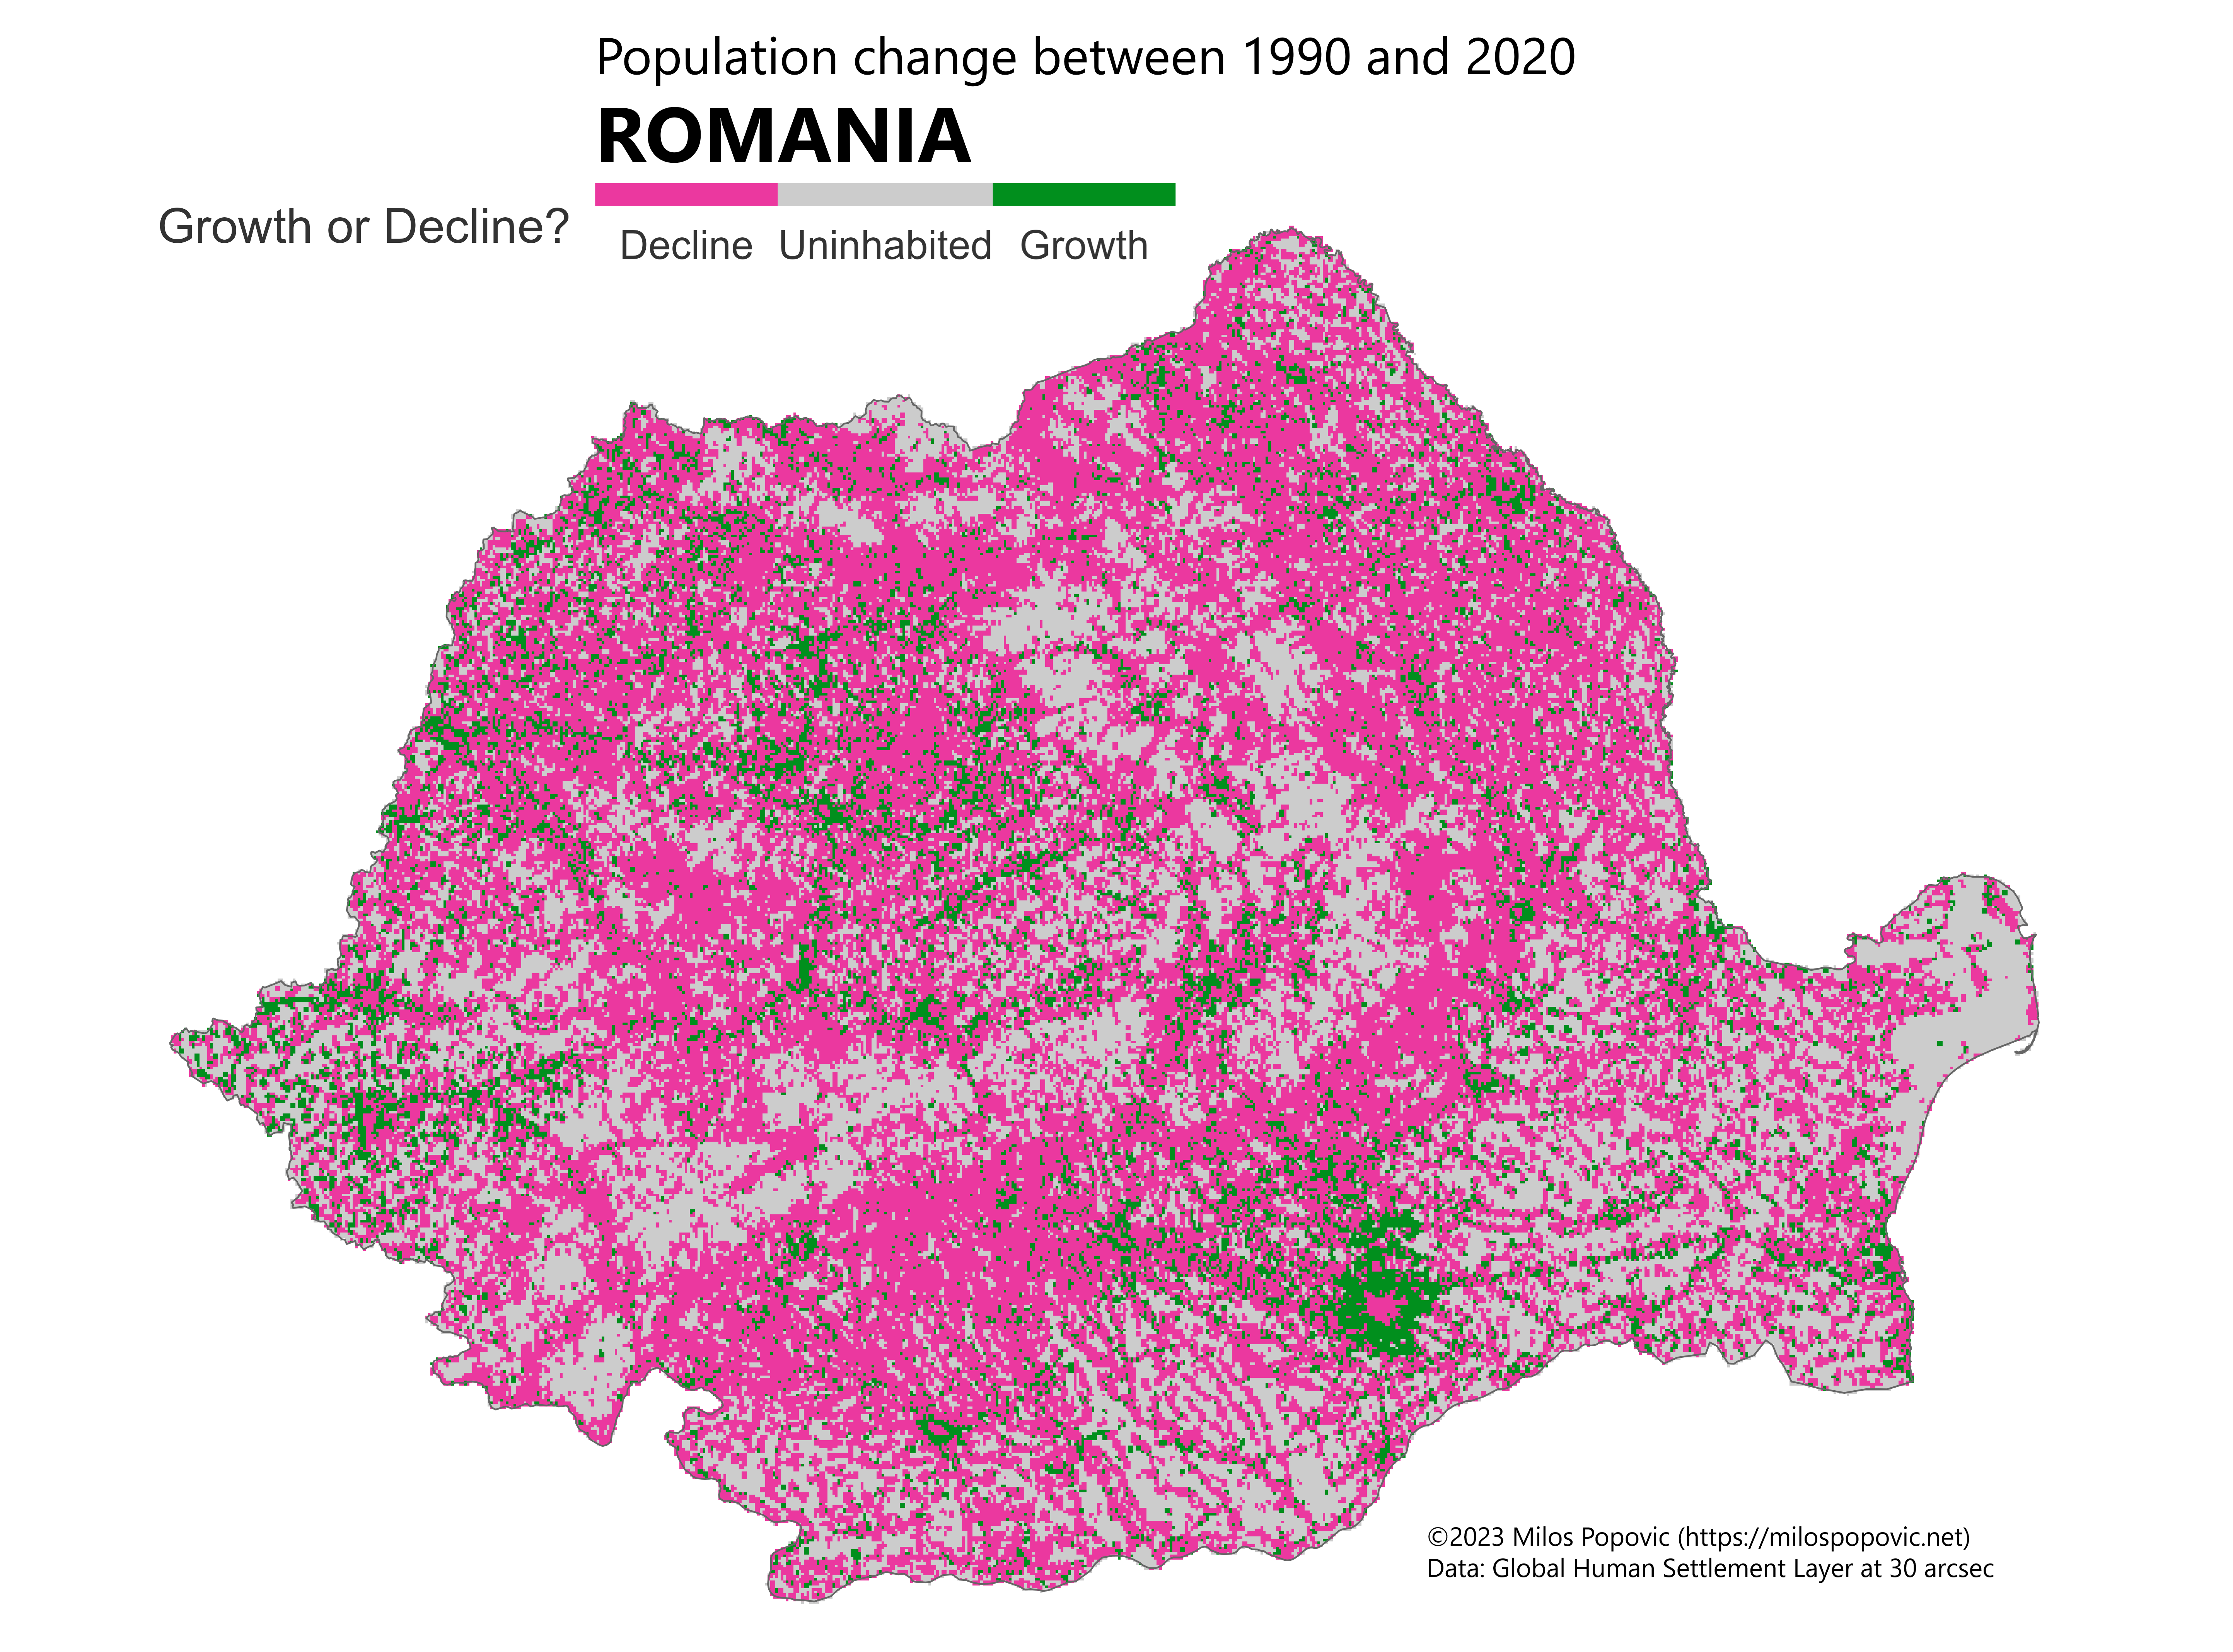
In this repo, I show you how to map the population change in Romania from 1990 to 2020 using ggplot2 in R. 🗺️ I use the GHSL population data, which provides high-resolution population rasters for the whole world. 🌎 I take the difference between the 1990 and 2020 rasters to calculate the population change in each pixel. 🧮