Concerning this dataset and due to the vast amount of time it would take to collect 1,000 shows one by one; the individual gathered method preyed on Netflix’s suggestion engine. The suggestion engine recommends shows like those selected in this dataset. "As part of this data set, I took 4 videos from 4 ratings (totaling 16 unique shows), then pulled 53 suggested shows per video. The ratings include G, PG, TV-14, TV-MA. I chose not to pull from every rating (e.g. TV-G, TV-Y, etc.). "- Chase Willden

| Jorge A. Lima | |
|---|---|
 |
|
| |
Python
- Table of contents
- Setup
- Import Statements
- Data Exploration
- You can applaud my story on Medium here
- Here is a link to my code
- License
- Load the data as a pandas data frame.
- Validate that it has the appropriate number of observations (checking the raw file, and also read the dataset description from data.world Netflix ).
source: data.world Netflix Suggestion Engine
Jupyter notebook
text editor
or
Google Colab
# Let's begin by importing pandas
# We also imported numpy, matplotlib, and seaborn

#classics
import pandas as pd
import numpy as np
import matplotlib.pyplot as plt
import seaborn as sns
# We use the pandas method pandas.read_csv("filepath") to create a DataFrame
# and assign it to a variable df.
# We'll use the head() method, which by default prints out the first 5 rows.
# We're supposed to have 1000 observations (rows) and seven columns.

pd.options.display.max_rows=999
pd.options.display.max_columns=100

df=pd.read_csv("netflix-netflix-shows-QueryResult.csv")

df.replace("?", np.NaN)
print(df.shape)
df.head()
First, I wanted to see if Netflix had a diverse library of content with the array of ratings. I found within the dataset that they have twelve categorical ratings, ranging from G to TV-MA.
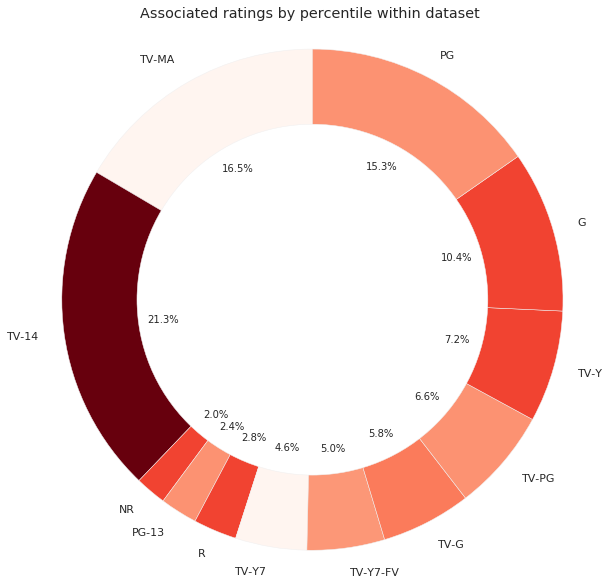
The rating system from Netflix indicates how the audience it's broken down by rating:
- Little Kids G, TV-Y, TV-G
- Older Kids PG, TV-Y7, TV-Y7-FV, TV-PG
- Teens PG-13, TV-14
- Mature R, NC-17, TV-MA
another source: Film Ratings
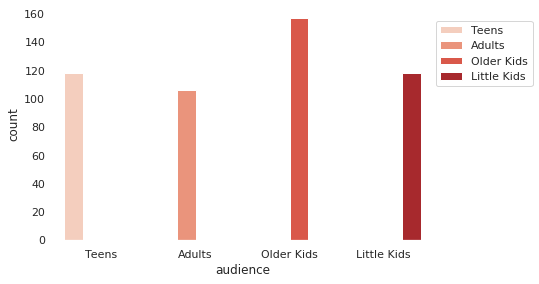
Secondly, I wanted to see the correlation of the Audience Age’s impact to the individual user rating score and how that may affect the library as a whole.
I used feature engineering by adding an audience column to our dataset, which allowed me to associate the ratings from show ratings by individualities. In this case: Little Kids, Older Kids, Teens, and Mature.
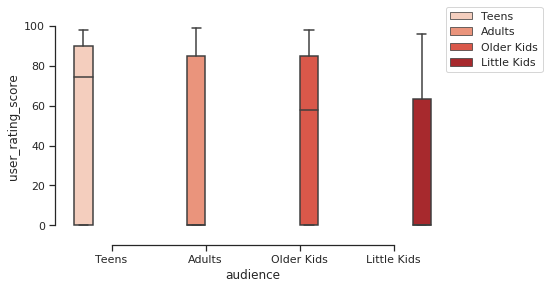
Some may asks… how can a minor user score be even validated? I do not know. There is not enough data to support that thesis. But, since this dataset, Netflix has implemented the ability for the consumer to rate the content with a “thumbs up” or “thumbs down.” This could make a minor more able to rate content viewed. My theory as a parent is that the previous method was most likely rated by an adult.
Source: Netflix on new Netflix Ratings & Recommendations
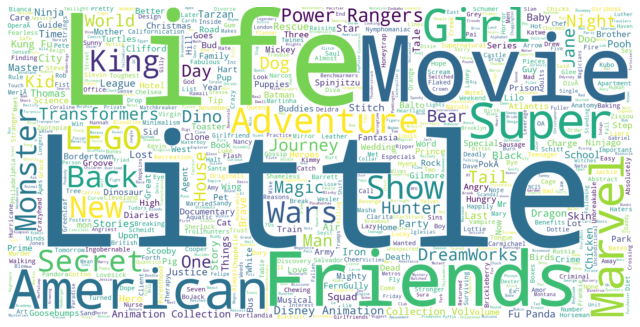
Lastly, I wanted to figure out Netflix’s popular shows by title. This would allow me to determine how and if they are relevant to its selection process regarding user rating scores.
I utilized a word cloud to see which titles within the dataset are most popular. As one can acknowledge from this research, Netflix does a great job making sure it meets its demand by assuring the proper titles are in their library.
Working with this dataset with a past career in motion pictures was fascinating. To learn the skills I have within a few week’s time I was able to dissect, articulate, extract and feature engineer this data set. From working on this project, it makes sense how studios select which projects move forward and particularly how studios stick with these models to make it easier to predict and help the selection process. For a platform such as Netflix, the amount of content in their library allows audiences to view content a La carte, leaving their subscribers tuned in and pleased.

- MIT license
- Copyright 2019-2020 © Jorge A. Lima.